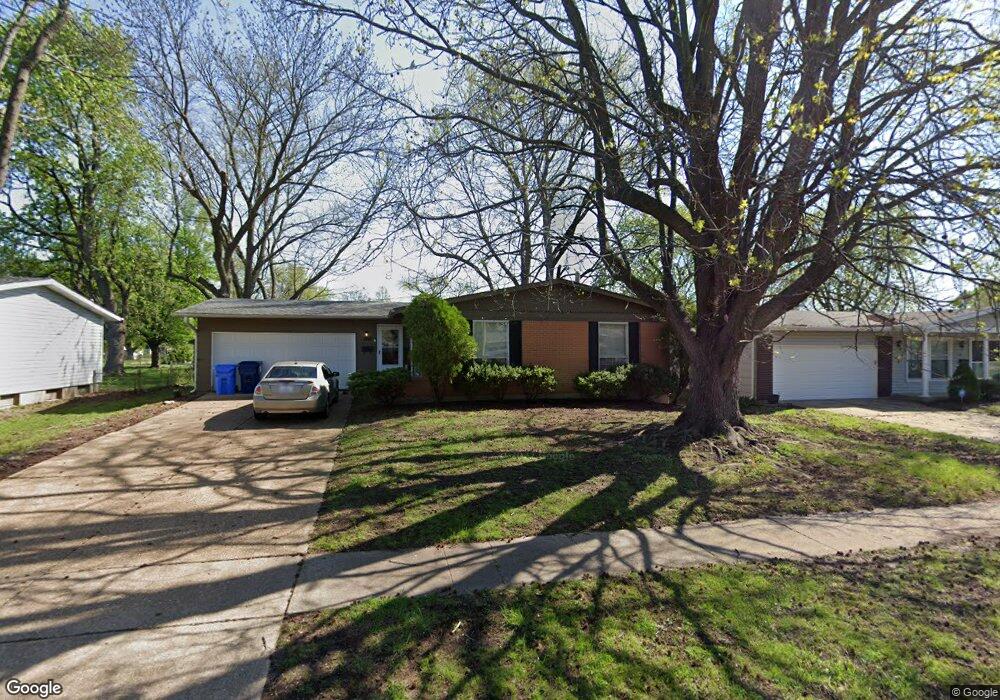
1365 Flamingo Dr Florissant, MO 63031
Estimated Value: $138,000 - $202,000
3
Beds
2
Baths
1,198
Sq Ft
$144/Sq Ft
Est. Value
About This Home
This home is located at 1365 Flamingo Dr, Florissant, MO 63031 and is currently estimated at $172,628, approximately $144 per square foot. 1365 Flamingo Dr is a home located in St. Louis County with nearby schools including Walker Elementary School, Northwest Middle School, and Hazelwood West High School.
Ownership History
Date
Name
Owned For
Owner Type
Purchase Details
Closed on
Dec 6, 2023
Sold by
Smp Homes 3B Llc
Bought by
Vinebrook Homes Borrower 1 Llc
Current Estimated Value
Home Financials for this Owner
Home Financials are based on the most recent Mortgage that was taken out on this home.
Original Mortgage
$392,180,000
Outstanding Balance
$386,023,832
Interest Rate
7.79%
Mortgage Type
New Conventional
Estimated Equity
-$385,851,204
Purchase Details
Closed on
Nov 29, 2016
Sold by
Smp Homes Llc
Bought by
Smp Homes 3B Llc
Home Financials for this Owner
Home Financials are based on the most recent Mortgage that was taken out on this home.
Original Mortgage
$9,874,900
Interest Rate
3.47%
Mortgage Type
Future Advance Clause Open End Mortgage
Purchase Details
Closed on
Jul 31, 2014
Sold by
Core Properties Llc
Bought by
Smp Homes Llc
Purchase Details
Closed on
Jun 19, 2014
Sold by
Bagley Richard L and Bergghoff Stepnanie Lyne
Bought by
Core Properties Llc
Create a Home Valuation Report for This Property
The Home Valuation Report is an in-depth analysis detailing your home's value as well as a comparison with similar homes in the area
Home Values in the Area
Average Home Value in this Area
Purchase History
| Date | Buyer | Sale Price | Title Company |
|---|---|---|---|
| Vinebrook Homes Borrower 1 Llc | -- | Os National | |
| Smp Homes 3B Llc | -- | None Available | |
| Smp Homes Llc | $57,000 | Orntic | |
| Core Properties Llc | -- | Insight Title |
Source: Public Records
Mortgage History
| Date | Status | Borrower | Loan Amount |
|---|---|---|---|
| Open | Vinebrook Homes Borrower 1 Llc | $392,180,000 | |
| Previous Owner | Smp Homes 3B Llc | $9,874,900 |
Source: Public Records
Tax History Compared to Growth
Tax History
| Year | Tax Paid | Tax Assessment Tax Assessment Total Assessment is a certain percentage of the fair market value that is determined by local assessors to be the total taxable value of land and additions on the property. | Land | Improvement |
|---|---|---|---|---|
| 2025 | $2,487 | $32,180 | $5,620 | $26,560 |
| 2024 | $2,487 | $27,800 | $2,890 | $24,910 |
| 2023 | $2,487 | $27,800 | $2,890 | $24,910 |
| 2022 | $2,434 | $24,310 | $4,830 | $19,480 |
| 2021 | $2,371 | $24,310 | $4,830 | $19,480 |
| 2020 | $2,242 | $21,590 | $3,710 | $17,880 |
| 2019 | $2,208 | $21,590 | $3,710 | $17,880 |
| 2018 | $2,018 | $18,130 | $2,470 | $15,660 |
| 2017 | $2,016 | $18,130 | $2,470 | $15,660 |
| 2016 | $1,816 | $16,090 | $2,470 | $13,620 |
| 2015 | $1,778 | $16,090 | $2,470 | $13,620 |
| 2014 | $1,891 | $17,660 | $3,880 | $13,780 |
Source: Public Records
Map
Nearby Homes
- 1395 Bluebird Dr
- 1150 Verlene Dr
- 1120 Bluebird Dr
- 1505 Swallow Ln
- 1155 Mullanphy Rd
- 915 Iris Dr
- 1415 Boulder Dr
- 2186 Aristocrat Dr
- 2255 Collier Dr
- 2040 Splendor Dr
- 890 Tyson Dr
- 1825 Swallow Ln
- 1075 Lees Ln
- 1920 Shackelford Rd
- 6 Charlotte Dr
- 1830 New Sun Ct
- 2048 New Sun Dr
- 660 Crabapple Ln
- 200 Francisca Dr
- 685 Mullanphy Rd
- 1375 Flamingo Dr
- 1355 Flamingo Dr
- 1280 Verlene Dr
- 1290 Verlene Dr
- 1385 Flamingo Dr
- 1345 Flamingo Dr
- 1450 Loveland Dr
- 1370 Flamingo Dr
- 1270 Verlene Dr
- 1360 Flamingo Dr
- 1470 Loveland Dr
- 1380 Flamingo Dr
- 1310 Verlene Dr
- 1350 Flamingo Dr
- 1335 Flamingo Dr
- 1400 Loveland Dr
- 1250 Verlene Dr
- 1490 Loveland Dr
- 1340 Flamingo Dr
- 1355 Bluebird Dr