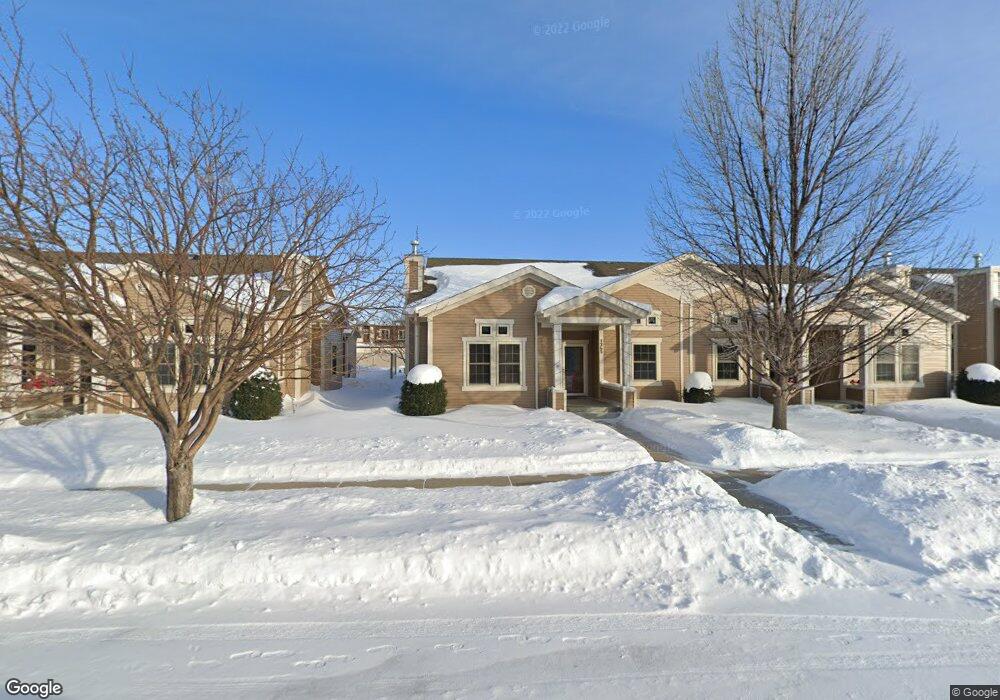
1365 Highpointe Dr N Fargo, ND 58102
Roosevelt NeighborhoodEstimated Value: $379,000 - $475,000
4
Beds
3
Baths
3,702
Sq Ft
$116/Sq Ft
Est. Value
About This Home
This home is located at 1365 Highpointe Dr N, Fargo, ND 58102 and is currently estimated at $428,410, approximately $115 per square foot. 1365 Highpointe Dr N is a home located in Cass County with nearby schools including Horace Mann Roosevelt Elementary School, Ben Franklin Middle School, and North High School.
Ownership History
Date
Name
Owned For
Owner Type
Purchase Details
Closed on
Aug 31, 2011
Sold by
Olstad Bruce A and Olstad Doris J
Bought by
Garvey Richard J and Garvey Nancy S
Current Estimated Value
Home Financials for this Owner
Home Financials are based on the most recent Mortgage that was taken out on this home.
Original Mortgage
$100,000
Outstanding Balance
$69,517
Interest Rate
4.58%
Mortgage Type
New Conventional
Estimated Equity
$358,893
Purchase Details
Closed on
Aug 31, 2005
Sold by
Cityscapes Development Llc
Bought by
Olstad Bruce A and Olstad Doris J
Home Financials for this Owner
Home Financials are based on the most recent Mortgage that was taken out on this home.
Original Mortgage
$127,200
Interest Rate
5.82%
Mortgage Type
New Conventional
Create a Home Valuation Report for This Property
The Home Valuation Report is an in-depth analysis detailing your home's value as well as a comparison with similar homes in the area
Home Values in the Area
Average Home Value in this Area
Purchase History
| Date | Buyer | Sale Price | Title Company |
|---|---|---|---|
| Garvey Richard J | -- | -- | |
| Olstad Bruce A | -- | -- |
Source: Public Records
Mortgage History
| Date | Status | Borrower | Loan Amount |
|---|---|---|---|
| Open | Garvey Richard J | $100,000 | |
| Previous Owner | Olstad Bruce A | $127,200 |
Source: Public Records
Tax History
| Year | Tax Paid | Tax Assessment Tax Assessment Total Assessment is a certain percentage of the fair market value that is determined by local assessors to be the total taxable value of land and additions on the property. | Land | Improvement |
|---|---|---|---|---|
| 2024 | $5,745 | $231,550 | $23,900 | $207,650 |
| 2023 | $6,183 | $231,550 | $23,900 | $207,650 |
| 2022 | $6,151 | $214,400 | $23,900 | $190,500 |
| 2021 | $5,774 | $204,200 | $23,900 | $180,300 |
| 2020 | $5,702 | $204,200 | $23,900 | $180,300 |
| 2019 | $5,399 | $192,450 | $16,850 | $175,600 |
| 2018 | $5,334 | $192,450 | $16,850 | $175,600 |
| 2017 | $5,011 | $183,300 | $16,850 | $166,450 |
| 2016 | $4,228 | $166,650 | $16,850 | $149,800 |
| 2015 | $4,489 | $166,650 | $10,000 | $156,650 |
| 2014 | $3,834 | $137,100 | $10,000 | $127,100 |
| 2013 | $3,669 | $130,550 | $10,000 | $120,550 |
Source: Public Records
Map
Nearby Homes
- 1437 Broadway N Unit 101
- 1441 Broadway N Unit 203
- 1345 4th St N
- 1349 4th St N
- 1257 4th St N
- 1235 11 1 2 St N
- 1345 3rd St N
- 1119 Broadway N
- 1119 9th St N
- 1125 5th St N
- 1525 10th St N
- 1109 10th St N
- 809 11th Ave N
- 1249 2nd St N
- 1045 10th St N
- 1530 11th St N
- 1105 11th St N
- 1613 10th St N
- 1630 7th St N
- 1245 1st St N
- 1363 Highpointe Dr N
- 1371 Highpointe Dr N
- 1373 Highpointe Dr N
- 1353 Highpointe Dr N
- 1351 Highpointe Dr N
- 1385 Highpointe Dr N
- 1387 Highpointe Dr N
- 1365 8th St N
- 1375 8th St N
- 1377 8th St N
- 1347 8th St N
- 1393 Highpointe Dr N
- 1345 8th St N
- 1367 8th St N
- 1310 Broadway N
- 1310 Broadway N
- 1342 Broadway N
- 1342 Broadway N
- 705 13th Ave N
- 1402 7th St N
Your Personal Tour Guide
Ask me questions while you tour the home.