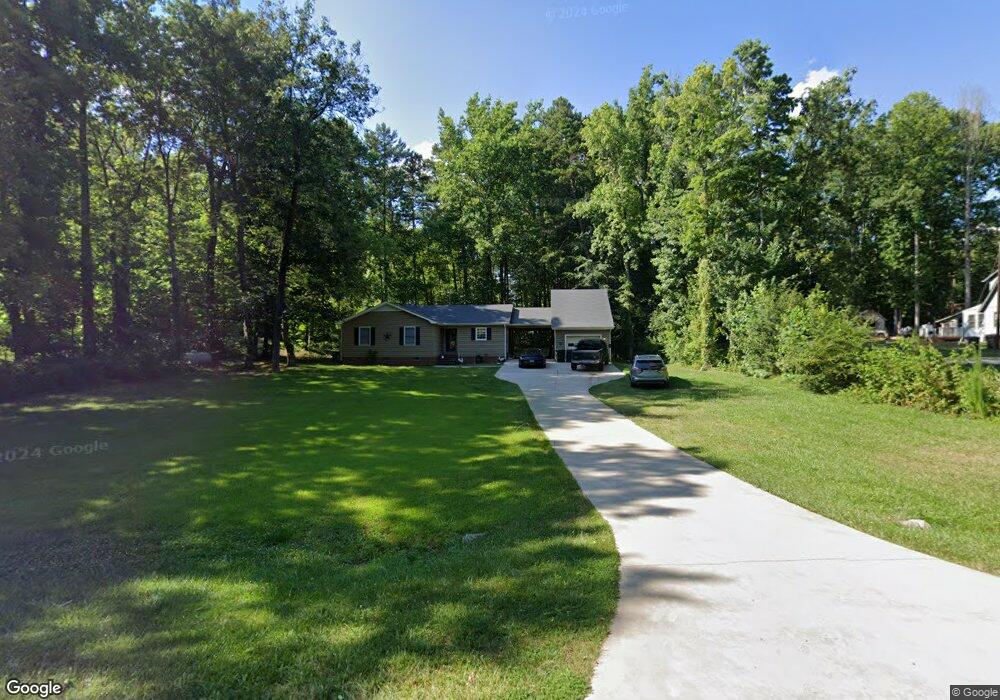
1366 Arabian Dr Asheboro, NC 27205
Estimated Value: $190,000 - $264,000
--
Bed
2
Baths
1,389
Sq Ft
$169/Sq Ft
Est. Value
About This Home
This home is located at 1366 Arabian Dr, Asheboro, NC 27205 and is currently estimated at $235,192, approximately $169 per square foot. 1366 Arabian Dr is a home located in Randolph County with nearby schools including Sycamore Elementary School, Southmont Elementary School, and Southwestern Randolph Middle School.
Ownership History
Date
Name
Owned For
Owner Type
Purchase Details
Closed on
Aug 6, 2020
Sold by
Vinocur Patricia A and Turner Weldon R
Bought by
Turner Weldon R and Turner Sherry A
Current Estimated Value
Home Financials for this Owner
Home Financials are based on the most recent Mortgage that was taken out on this home.
Original Mortgage
$130,000
Outstanding Balance
$103,700
Interest Rate
3.1%
Mortgage Type
New Conventional
Estimated Equity
$131,492
Purchase Details
Closed on
Jun 30, 2006
Sold by
Cain John S and Cain Annette B
Bought by
Martin Gary D and Vinocur Patricia
Home Financials for this Owner
Home Financials are based on the most recent Mortgage that was taken out on this home.
Original Mortgage
$103,200
Interest Rate
6.57%
Mortgage Type
Purchase Money Mortgage
Purchase Details
Closed on
Jan 8, 1990
Bought by
Vinocur Patricia A Martin Gary D
Create a Home Valuation Report for This Property
The Home Valuation Report is an in-depth analysis detailing your home's value as well as a comparison with similar homes in the area
Home Values in the Area
Average Home Value in this Area
Purchase History
| Date | Buyer | Sale Price | Title Company |
|---|---|---|---|
| Turner Weldon R | $130,000 | None Available | |
| Martin Gary D | $129,000 | None Available | |
| Vinocur Patricia A Martin Gary D | $68,000 | -- |
Source: Public Records
Mortgage History
| Date | Status | Borrower | Loan Amount |
|---|---|---|---|
| Open | Turner Weldon R | $130,000 | |
| Previous Owner | Martin Gary D | $103,200 |
Source: Public Records
Tax History Compared to Growth
Tax History
| Year | Tax Paid | Tax Assessment Tax Assessment Total Assessment is a certain percentage of the fair market value that is determined by local assessors to be the total taxable value of land and additions on the property. | Land | Improvement |
|---|---|---|---|---|
| 2025 | $1,092 | $176,070 | $37,520 | $138,550 |
| 2024 | $1,092 | $176,070 | $37,520 | $138,550 |
| 2023 | $1,092 | $176,070 | $37,520 | $138,550 |
| 2022 | $907 | $120,490 | $21,380 | $99,110 |
| 2021 | $907 | $120,490 | $21,380 | $99,110 |
| 2020 | $875 | $121,110 | $21,380 | $99,730 |
| 2019 | $875 | $121,110 | $21,380 | $99,730 |
| 2018 | $834 | $112,380 | $16,360 | $96,020 |
| 2016 | $812 | $112,379 | $16,360 | $96,019 |
| 2015 | $815 | $112,379 | $16,360 | $96,019 |
| 2014 | -- | $112,379 | $16,360 | $96,019 |
Source: Public Records
Map
Nearby Homes
- 0 Danny Bell Rd
- 1676 Mack Rd
- 0 Muriel Ln
- 1575 Leslie St
- 1624 Ashbrook View Ln
- 1522 Hopewell Friends Rd
- 2500 Westgate Rd
- 1564 Walker Rd
- 00 Route 220 Hwy
- o Southmont Dr
- 1416 Southmont Dr
- 708 Dawson Miller Rd
- 1301 Nc Highway 49 S
- 2272 Doul Mountain Rd
- 2318 Doul Mountain Rd
- 0 Nc Highway 49 S Unit 1162269
- 2634 Fox Ridge Rd
- 2626 Fox Ridge Rd
- 0 Fox Ridge Rd Unit 1197775
- Lot 37 Fox Ridge Rd
- 1358 Arabian Dr
- 1325 Appaloosa Trail
- 1349 Arabian Dr
- 1334 Arabian Dr
- 1892 Palomino Dr
- 1311 Appaloosa Trail
- 1794 Palomino Dr
- 1876 Palomino Dr
- 1898 Palomino Dr
- 1330 Appaloosa Trail
- 1329 Arabian Dr
- 1293 Appaloosa Trail
- 1211 Appaloosa Trail
- 1780 Palomino Dr
- 1315 Arabian Dr
- 1229 Appaloosa Trail
- 1771 Palomino Dr
- 1273 Appaloosa Trail
- 1307 Arabian Dr
- 1286 Appaloosa Trail