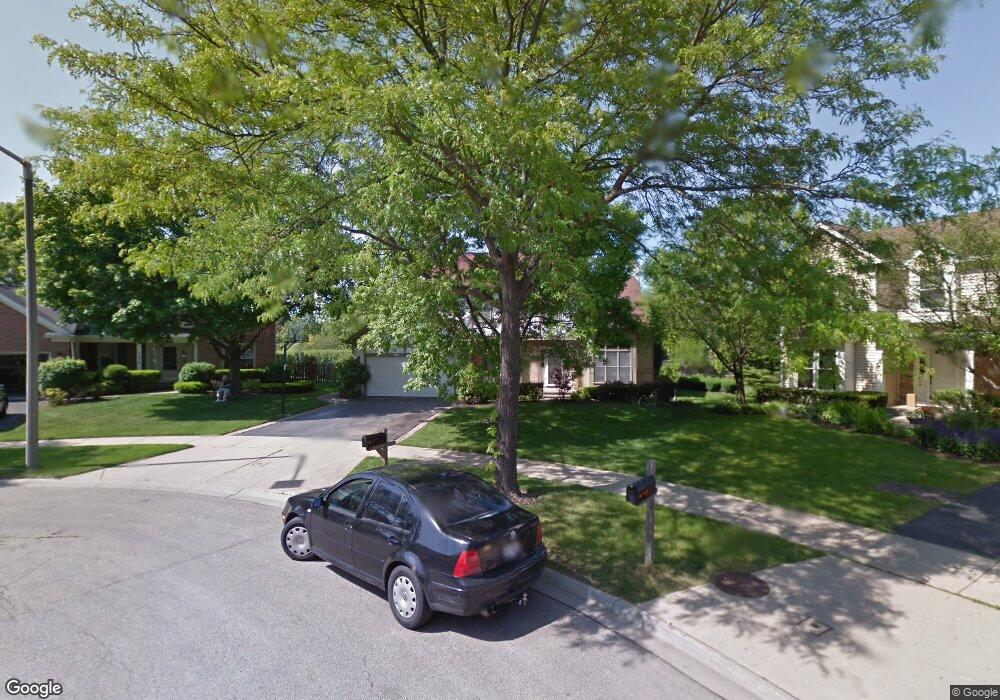
1366 Berkley Ct Buffalo Grove, IL 60089
Estimated Value: $624,982 - $702,000
3
Beds
3
Baths
2,206
Sq Ft
$309/Sq Ft
Est. Value
About This Home
This home is located at 1366 Berkley Ct, Buffalo Grove, IL 60089 and is currently estimated at $682,746, approximately $309 per square foot. 1366 Berkley Ct is a home located in Lake County with nearby schools including Meridian Middle School, Tripp Elementary School, and Aptakisic Junior High School.
Ownership History
Date
Name
Owned For
Owner Type
Purchase Details
Closed on
May 23, 2024
Sold by
Crossley Scott and Crossley Robin
Bought by
Scott Crossley Living Trust and Robin Crossley Living Trust
Current Estimated Value
Purchase Details
Closed on
Jul 24, 2003
Sold by
Prudential Residential Service Lp
Bought by
Crossley Scott and Crossley Robin
Home Financials for this Owner
Home Financials are based on the most recent Mortgage that was taken out on this home.
Original Mortgage
$290,000
Interest Rate
6.18%
Mortgage Type
Purchase Money Mortgage
Purchase Details
Closed on
May 6, 2003
Sold by
Mchale David A and Mchale Arlene M
Bought by
Prudential Residential Service Lp and Prudentiaql Homes Corp
Purchase Details
Closed on
Dec 11, 1997
Sold by
Glatz Charles S and Glatz Lisa S
Bought by
Mchale David A and Mchale Arlene M
Home Financials for this Owner
Home Financials are based on the most recent Mortgage that was taken out on this home.
Original Mortgage
$267,300
Interest Rate
6.62%
Create a Home Valuation Report for This Property
The Home Valuation Report is an in-depth analysis detailing your home's value as well as a comparison with similar homes in the area
Home Values in the Area
Average Home Value in this Area
Purchase History
| Date | Buyer | Sale Price | Title Company |
|---|---|---|---|
| Scott Crossley Living Trust | -- | None Listed On Document | |
| Crossley Scott | $443,000 | Ticor Title Insurance Compan | |
| Prudential Residential Service Lp | $443,000 | -- | |
| Mchale David A | $297,000 | Burnet Title Llc |
Source: Public Records
Mortgage History
| Date | Status | Borrower | Loan Amount |
|---|---|---|---|
| Previous Owner | Crossley Scott | $290,000 | |
| Previous Owner | Mchale David A | $267,300 |
Source: Public Records
Tax History Compared to Growth
Tax History
| Year | Tax Paid | Tax Assessment Tax Assessment Total Assessment is a certain percentage of the fair market value that is determined by local assessors to be the total taxable value of land and additions on the property. | Land | Improvement |
|---|---|---|---|---|
| 2024 | $17,641 | $183,896 | $53,177 | $130,719 |
| 2023 | $15,421 | $179,285 | $48,246 | $131,039 |
| 2022 | $15,421 | $163,843 | $44,091 | $119,752 |
| 2021 | $14,875 | $162,077 | $43,616 | $118,461 |
| 2020 | $14,585 | $162,630 | $43,765 | $118,865 |
| 2019 | $14,198 | $162,031 | $43,604 | $118,427 |
| 2018 | $14,757 | $167,855 | $47,401 | $120,454 |
| 2017 | $14,566 | $163,937 | $46,295 | $117,642 |
| 2016 | $14,064 | $156,983 | $44,331 | $112,652 |
| 2015 | $13,791 | $146,809 | $41,458 | $105,351 |
| 2014 | $12,384 | $131,015 | $44,526 | $86,489 |
| 2012 | $11,988 | $131,277 | $44,615 | $86,662 |
Source: Public Records
Map
Nearby Homes
- 15 Thompson Ct
- 1272 Sandhurst Dr
- 148 White Branch Ct
- 1012 Hobson Dr
- 1113 Lockwood Dr
- 1118 Larraway Dr
- 538 Lasalle Ct
- 938 Hidden Lake Dr
- 22118 N Prairie Rd
- 1157 Russellwood Ct
- 60 E Fabish Dr
- 51 W Fabish Dr
- 268 Hoffmann Dr
- 16202 W Aptakisic Rd
- 327 Lasalle Ln
- 361 Hoffmann Dr
- 381 Bentley Place
- 2033 Olive Hill Dr
- 393 Bentley Place
- 2071 Wright Blvd
- 1356 Berkley Ct
- 1376 Berkley Ct
- 75 Newfield Dr
- 85 Newfield Dr
- 65 Newfield Dr
- 1346 Berkley Ct
- 55 Newfield Dr
- 95 Newfield Dr
- 1396 Berkley Ct
- 1336 Berkley Ct
- 45 Newfield Dr
- 147 Copperwood Dr
- 1326 Berkley Ct
- 151 Copperwood Dr
- 35 Newfield Dr
- 141 Copperwood Dr
- 157 Copperwood Dr
- 103 Newfield Dr
- 1352 Crossfield Ct
- 1406 Berkley Ct