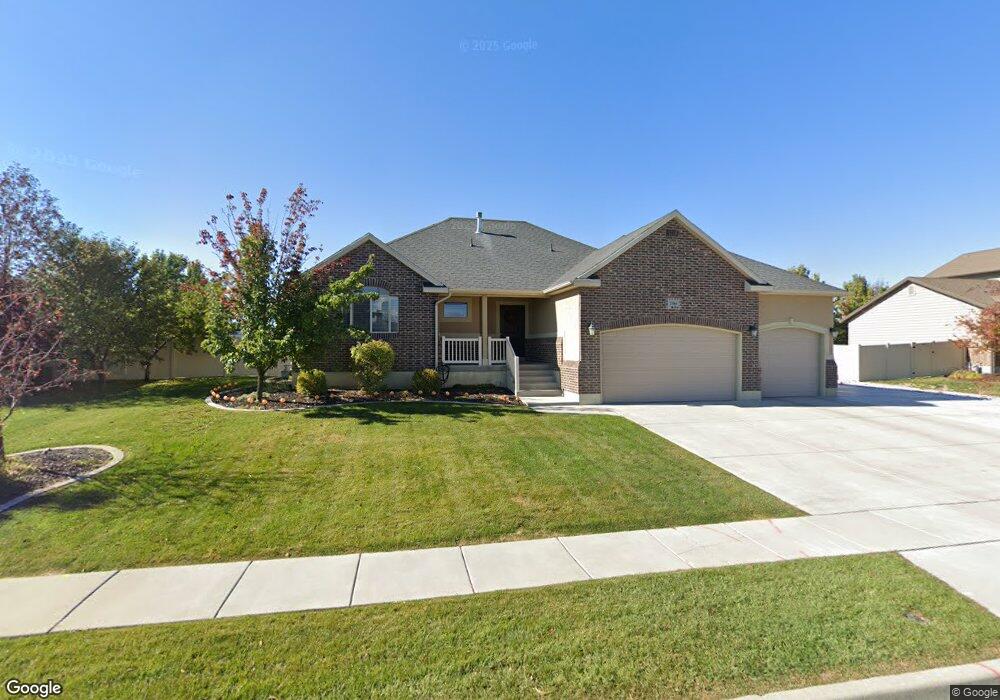
1366 S 4465 W Unit 207 Syracuse, UT 84075
Estimated Value: $606,000 - $662,000
5
Beds
3
Baths
1,427
Sq Ft
$449/Sq Ft
Est. Value
About This Home
This home is located at 1366 S 4465 W Unit 207, Syracuse, UT 84075 and is currently estimated at $640,049, approximately $448 per square foot. 1366 S 4465 W Unit 207 is a home located in Davis County with nearby schools including Buffalo Point School, Syracuse Junior High School, and Syracuse High School.
Ownership History
Date
Name
Owned For
Owner Type
Purchase Details
Closed on
Jun 27, 2012
Sold by
Psion Homes
Bought by
Mcgary Justin and Mcgary Melissa
Current Estimated Value
Home Financials for this Owner
Home Financials are based on the most recent Mortgage that was taken out on this home.
Original Mortgage
$193,425
Outstanding Balance
$133,483
Interest Rate
3.74%
Mortgage Type
New Conventional
Estimated Equity
$506,566
Purchase Details
Closed on
Mar 28, 2012
Sold by
Richard & Robyn Investments Llc
Bought by
Psion Homes
Home Financials for this Owner
Home Financials are based on the most recent Mortgage that was taken out on this home.
Original Mortgage
$165,000
Interest Rate
3.83%
Mortgage Type
Purchase Money Mortgage
Purchase Details
Closed on
Jan 20, 2010
Sold by
Thurgood Richard G and Thurgood Robyn
Bought by
Richard & Robyn Investments Llc
Purchase Details
Closed on
Apr 19, 2007
Sold by
Bridgeway Island Llc
Bought by
Thurgood Richard G and Thurgood Robyn
Create a Home Valuation Report for This Property
The Home Valuation Report is an in-depth analysis detailing your home's value as well as a comparison with similar homes in the area
Home Values in the Area
Average Home Value in this Area
Purchase History
| Date | Buyer | Sale Price | Title Company |
|---|---|---|---|
| Mcgary Justin | -- | Founders Title Co La | |
| Psion Homes | -- | Bonneville Superior | |
| Richard & Robyn Investments Llc | -- | None Available | |
| Thurgood Richard G | -- | Bonneville Superior Title Co |
Source: Public Records
Mortgage History
| Date | Status | Borrower | Loan Amount |
|---|---|---|---|
| Open | Mcgary Justin | $193,425 | |
| Previous Owner | Psion Homes | $165,000 |
Source: Public Records
Tax History Compared to Growth
Tax History
| Year | Tax Paid | Tax Assessment Tax Assessment Total Assessment is a certain percentage of the fair market value that is determined by local assessors to be the total taxable value of land and additions on the property. | Land | Improvement |
|---|---|---|---|---|
| 2025 | $3,483 | $336,050 | $109,633 | $226,417 |
| 2024 | $3,312 | $321,750 | $88,038 | $233,712 |
| 2023 | $3,113 | $551,000 | $133,296 | $417,704 |
| 2022 | $3,095 | $300,300 | $67,022 | $233,278 |
| 2021 | $2,823 | $424,000 | $97,682 | $326,318 |
| 2020 | $2,379 | $346,000 | $79,016 | $266,984 |
| 2019 | $2,180 | $313,000 | $82,735 | $230,265 |
| 2018 | $2,028 | $289,000 | $80,412 | $208,588 |
| 2016 | $1,980 | $147,950 | $33,006 | $114,944 |
| 2015 | $1,973 | $140,415 | $33,653 | $106,762 |
| 2014 | $1,846 | $133,916 | $33,653 | $100,263 |
| 2013 | -- | $128,574 | $26,367 | $102,207 |
Source: Public Records
Map
Nearby Homes
- 1155 S 4475 W
- 1238 S 4290 W
- 1139 S 4475 W
- 1157 S 4425 W
- 4578 W 1150 S
- 4580 W 1700 S
- 4191 W 1425 S
- 1141 S 4700 W
- 4468 W 1050 S
- Bradford Plan at Harvest Fields
- Avery Plan at Harvest Fields
- Sullivan Plan at Harvest Fields
- Presley Plan at Harvest Fields
- Ashmore Plan at Harvest Fields
- Bridgeport Plan at Harvest Fields
- Malan Plan at Harvest Fields
- Havenwood Plan at Harvest Fields
- Hamilton Plan at Harvest Fields
- Havenwood with Loft Plan at Harvest Fields
- 964 S 4475 W Unit 123
- 1382 S 4465 W
- 1346 S 4465 W Unit 208
- 1346 S 4465 W
- 4447 W 1350 S Unit 239
- 4444 W 1350 S Unit 233
- 4484 W 1315 S
- 1372 S Homestead Ln
- 1352 S Homestead Ln
- 1414 S 4465 W
- 1392 S Homestead Ln Unit 115
- 4421 W 1350 S
- 4483 W 1315 S
- 1333 S 4465 W
- 4429 W 1315 S Unit 223
- 4422 W 1425 S
- 4420 W 1350 S Unit 234
- 4420 W 1350 S Unit 30
- 1332 S Homestead Ln Unit 112
- 4449 W 1425 S Unit 204
- 4449 W 1425 S