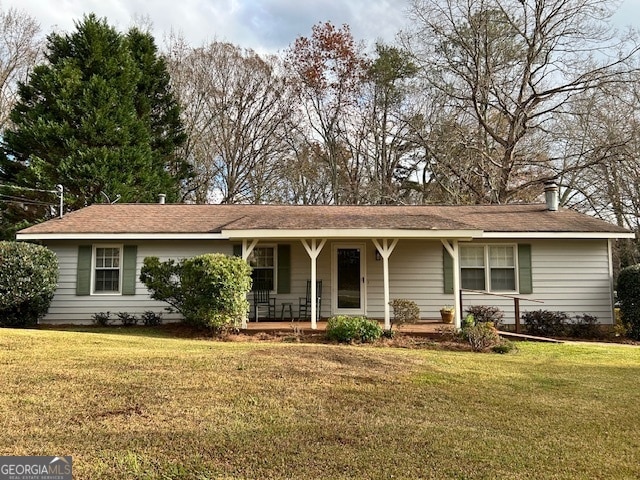
1366 Zebulon Rd Griffin, GA 30224
Spalding County NeighborhoodEstimated payment $1,340/month
Highlights
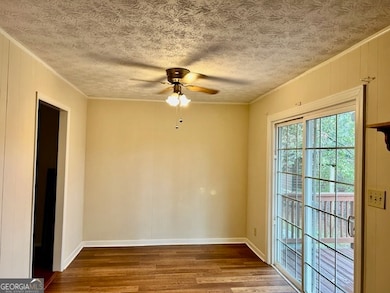
- Deck
- Traditional Architecture
- Corner Lot
- Vaulted Ceiling
- Wood Flooring
- No HOA
About This Home
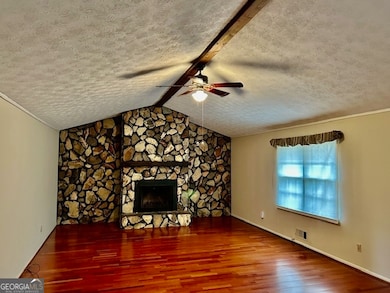
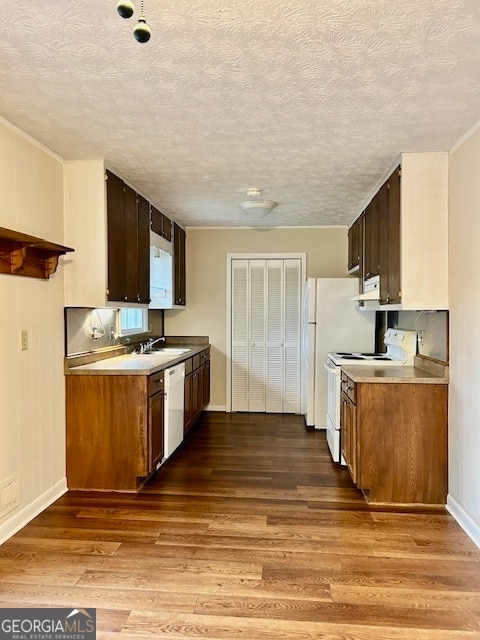
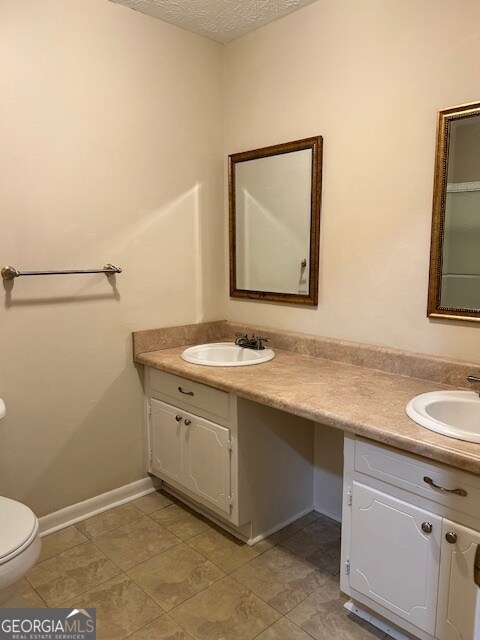
Don't miss out on this 3 bedroom, 2 bath charming home on Griffin's Southside. Large family room with vaulted beams ceiling and stone fireplace. Kitchen with eat-in breakfast area. Hall bathroom with double vanity, primary bedroom with full bath. Large fenced in back yard with deck. Rocking chair front porch. Well maintained home! Won't last long!
Home Details
Home Type
- Single Family
Est. Annual Taxes
- $2,349
Year Built
- Built in 1977
Lot Details
- 0.41 Acre Lot
- Back Yard Fenced
- Corner Lot
Home Design
- Traditional Architecture
- Composition Roof
- Wood Siding
Interior Spaces
- 1,404 Sq Ft Home
- 1-Story Property
- Beamed Ceilings
- Vaulted Ceiling
- Fireplace Features Masonry
- Family Room
- Crawl Space
- Pull Down Stairs to Attic
- Laundry in Kitchen
Kitchen
- Breakfast Area or Nook
- Oven or Range
- Dishwasher
Flooring
- Wood
- Carpet
- Tile
Bedrooms and Bathrooms
- 3 Main Level Bedrooms
- 2 Full Bathrooms
- Double Vanity
- Bathtub Includes Tile Surround
Parking
- 2 Parking Spaces
- Parking Accessed On Kitchen Level
Outdoor Features
- Deck
Schools
- Crescent Road Elementary School
- Rehoboth Road Middle School
- Spalding High School
Utilities
- Central Heating and Cooling System
- Heating System Uses Natural Gas
- Gas Water Heater
- Septic Tank
- High Speed Internet
- Phone Available
- Cable TV Available
Community Details
- No Home Owners Association
Listing and Financial Details
- Tax Lot 118
Map
Home Values in the Area
Average Home Value in this Area
Tax History
| Year | Tax Paid | Tax Assessment Tax Assessment Total Assessment is a certain percentage of the fair market value that is determined by local assessors to be the total taxable value of land and additions on the property. | Land | Improvement |
|---|---|---|---|---|
| 2025 | $1,147 | $65,650 | $10,000 | $55,650 |
| 2024 | $1,146 | $65,650 | $10,000 | $55,650 |
| 2023 | $960 | $49,488 | $8,000 | $41,488 |
| 2022 | $710 | $41,690 | $6,400 | $35,290 |
| 2021 | $633 | $37,770 | $6,400 | $31,370 |
| 2020 | $583 | $34,982 | $6,400 | $28,582 |
| 2019 | $579 | $34,285 | $6,400 | $27,885 |
| 2018 | $560 | $33,169 | $6,400 | $26,769 |
| 2017 | $475 | $31,595 | $6,400 | $25,195 |
| 2016 | $386 | $28,140 | $6,400 | $21,740 |
| 2015 | $408 | $28,140 | $6,400 | $21,740 |
| 2014 | $408 | $28,140 | $6,400 | $21,740 |
Property History
| Date | Event | Price | List to Sale | Price per Sq Ft |
|---|---|---|---|---|
| 01/28/2026 01/28/26 | Price Changed | $219,900 | -4.3% | $157 / Sq Ft |
| 12/09/2025 12/09/25 | For Sale | $229,900 | -- | $164 / Sq Ft |
Purchase History
| Date | Type | Sale Price | Title Company |
|---|---|---|---|
| Quit Claim Deed | -- | -- | |
| Deed | $80,000 | -- | |
| Deed | $31,900 | -- | |
| Deed | $2,600 | -- | |
| Deed | $477,000 | -- |
Mortgage History
| Date | Status | Loan Amount | Loan Type |
|---|---|---|---|
| Closed | $47,000 | New Conventional | |
| Previous Owner | $47,000 | New Conventional |
Source: Georgia MLS
MLS Number: 10655338
APN: 143B-04-002
Disclaimer: Certain information contained herein is derived from information provided by parties other than Homes.com. All information provided is deemed reliable, but is not guaranteed to be accurate and should be independently verified.
![]() The data relating to real estate for sale on this web site comes in part from the Broker Reciprocity Program of Georgia MLS. Real estate listings held by brokerage firms other than Redfin are marked with the Broker Reciprocity logo and detailed information about them includes the name of the listing brokers. Information deemed reliable but not guaranteed. Copyright 2026 Georgia MLS. All rights reserved.
The data relating to real estate for sale on this web site comes in part from the Broker Reciprocity Program of Georgia MLS. Real estate listings held by brokerage firms other than Redfin are marked with the Broker Reciprocity logo and detailed information about them includes the name of the listing brokers. Information deemed reliable but not guaranteed. Copyright 2026 Georgia MLS. All rights reserved.
- 1374 Zebulon Rd
- 110 Kline Cir
- 105 Jewel Dr
- 210 Laurel St
- 1226 Zebulon Rd
- 1522 Zebulon Rd
- 7 Crabapple Cir
- 236 Airport Rd
- 220 Airport Rd
- 112 Oak Ave SW
- 211 Clark Rd
- 1077 Coldwater Dr
- 133 Coldwater Ln
- 1082 Coldwater Dr
- TRACT B Zebulon Rd
- 1064 Cold Water Dr
- 215 Pineywood Rd
- 119 Townsend Ct
- 138 Townsend Ct
- 135 Townsend Ct
- 1069 Cold Water Dr
- 1030 S Hill St
- 1062 Cold Water Dr
- 701 Carver Rd
- 657 Carver Rd
- 600 S Pine Hill Rd
- 708 S Hill St Unit APARTMENT
- 1764 Cheryl Ave
- 717 Scales St
- 2101 Williamson Rd
- 1110 W Poplar St
- 301 S 18th St
- 617 Meriwether St
- 402 Meriwether St
- 1560 Flynt St
- 363 N 16th St
- 502 W Broadway St
- 523 E Chappell St
- 438 N 5th St
- 415 Jefferson St

Ask me questions while you tour the home.