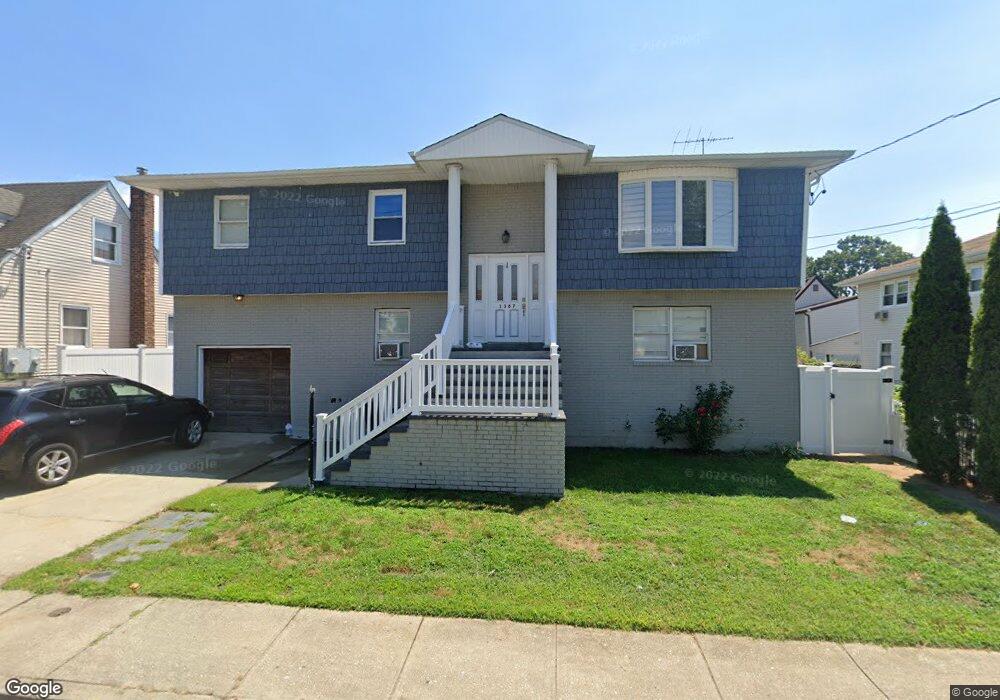
1367 E St Elmont, NY 11003
Estimated Value: $592,000 - $1,019,000
5
Beds
3
Baths
2,289
Sq Ft
$379/Sq Ft
Est. Value
About This Home
This home is located at 1367 E St, Elmont, NY 11003 and is currently estimated at $868,006, approximately $379 per square foot. 1367 E St is a home located in Nassau County with nearby schools including Cheder at the Ohel.
Ownership History
Date
Name
Owned For
Owner Type
Purchase Details
Closed on
Dec 31, 2019
Sold by
Maximus Paul Inc
Bought by
Gomez Juan and Sanchez Sebastian
Current Estimated Value
Home Financials for this Owner
Home Financials are based on the most recent Mortgage that was taken out on this home.
Original Mortgage
$638,226
Outstanding Balance
$570,753
Interest Rate
4.25%
Mortgage Type
FHA
Estimated Equity
$297,253
Purchase Details
Closed on
Apr 18, 2019
Sold by
Eliakim Joseph
Bought by
Maximus Paul Inc
Purchase Details
Closed on
Aug 30, 2000
Create a Home Valuation Report for This Property
The Home Valuation Report is an in-depth analysis detailing your home's value as well as a comparison with similar homes in the area
Home Values in the Area
Average Home Value in this Area
Purchase History
| Date | Buyer | Sale Price | Title Company |
|---|---|---|---|
| Gomez Juan | $650,000 | Westcor Land Title Ins Co | |
| Maximus Paul Inc | $415,000 | Fidelity National Title | |
| -- | $273,000 | -- |
Source: Public Records
Mortgage History
| Date | Status | Borrower | Loan Amount |
|---|---|---|---|
| Open | Gomez Juan | $638,226 |
Source: Public Records
Tax History
| Year | Tax Paid | Tax Assessment Tax Assessment Total Assessment is a certain percentage of the fair market value that is determined by local assessors to be the total taxable value of land and additions on the property. | Land | Improvement |
|---|---|---|---|---|
| 2025 | $16,833 | $672 | $248 | $424 |
| 2024 | $5,550 | $651 | $248 | $403 |
Source: Public Records
Map
Nearby Homes
Your Personal Tour Guide
Ask me questions while you tour the home.