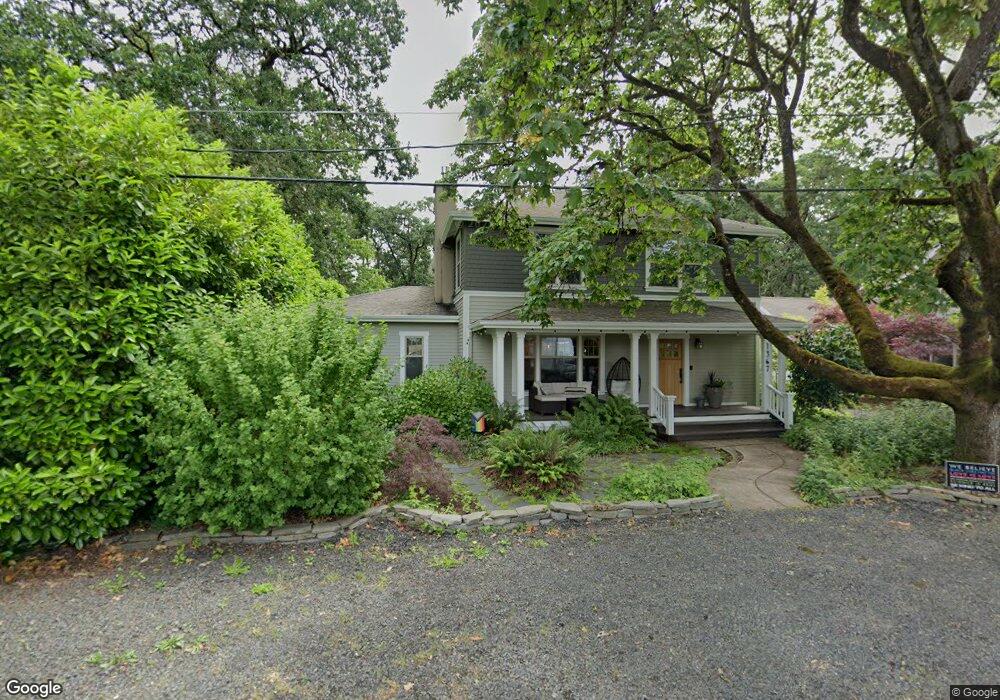
1367 Hammock St Eugene, OR 97401
Cal Young NeighborhoodEstimated Value: $679,000 - $925,000
4
Beds
3
Baths
2,354
Sq Ft
$329/Sq Ft
Est. Value
About This Home
This home is located at 1367 Hammock St, Eugene, OR 97401 and is currently estimated at $775,115, approximately $329 per square foot. 1367 Hammock St is a home located in Lane County with nearby schools including Willagillespie Elementary School, Cal Young Middle School, and Sheldon High School.
Ownership History
Date
Name
Owned For
Owner Type
Purchase Details
Closed on
Sep 11, 2013
Sold by
Johnson Travis and Johnson Erin J
Bought by
Steinbaugh Marc A and Steinbaugh Elly
Current Estimated Value
Purchase Details
Closed on
Jan 4, 2006
Sold by
Mikel Lomsky Co Inc
Bought by
Johnson Travis and Johnson Erin J
Home Financials for this Owner
Home Financials are based on the most recent Mortgage that was taken out on this home.
Original Mortgage
$314,000
Interest Rate
6.28%
Mortgage Type
Fannie Mae Freddie Mac
Purchase Details
Closed on
Apr 22, 2005
Sold by
Locust Street Llc
Bought by
Mikel Lomsky Co Inc
Home Financials for this Owner
Home Financials are based on the most recent Mortgage that was taken out on this home.
Original Mortgage
$330,000
Interest Rate
5.84%
Mortgage Type
Construction
Purchase Details
Closed on
Jan 14, 2005
Sold by
Benson Vern W
Bought by
Locust Street Llc
Create a Home Valuation Report for This Property
The Home Valuation Report is an in-depth analysis detailing your home's value as well as a comparison with similar homes in the area
Home Values in the Area
Average Home Value in this Area
Purchase History
| Date | Buyer | Sale Price | Title Company |
|---|---|---|---|
| Steinbaugh Marc A | $440,000 | Cascade Title Company | |
| Johnson Travis | $474,000 | Fidelity National Title Insu | |
| Mikel Lomsky Co Inc | -- | Fidelity National Title Insu | |
| Locust Street Llc | $183,500 | Fidelity Natl Title Co Of Or |
Source: Public Records
Mortgage History
| Date | Status | Borrower | Loan Amount |
|---|---|---|---|
| Previous Owner | Johnson Travis | $314,000 | |
| Previous Owner | Mikel Lomsky Co Inc | $330,000 |
Source: Public Records
Tax History
| Year | Tax Paid | Tax Assessment Tax Assessment Total Assessment is a certain percentage of the fair market value that is determined by local assessors to be the total taxable value of land and additions on the property. | Land | Improvement |
|---|---|---|---|---|
| 2025 | $8,095 | $415,464 | -- | -- |
| 2024 | $7,994 | $403,364 | -- | -- |
| 2023 | $7,994 | $391,616 | $0 | $0 |
| 2022 | $7,489 | $380,210 | $0 | $0 |
| 2021 | $7,034 | $369,136 | $0 | $0 |
| 2020 | $7,059 | $358,385 | $0 | $0 |
| 2019 | $6,817 | $347,947 | $0 | $0 |
| 2018 | $6,417 | $327,974 | $0 | $0 |
| 2017 | $6,125 | $327,974 | $0 | $0 |
| 2016 | $5,946 | $318,421 | $0 | $0 |
| 2015 | $5,734 | $309,147 | $0 | $0 |
| 2014 | $5,556 | $300,143 | $0 | $0 |
Source: Public Records
Map
Nearby Homes
- 1328 Spyglass Dr
- 0 Piper Ln Unit Lot 1
- 0 Piper Ln Unit Lot 3
- 0 Piper Ln Unit Lot 2
- 0 Piper Ln Unit Lot 5
- 1376 Brickley Rd
- 1500 Norkenzie Rd Unit 12
- 410 Spyglass Dr
- 1625 Monterey Ln
- 1230 Debrick Rd
- 0 Crenshaw Rd Unit 740506614
- 982 Shaughnessy Ln
- 0 Butte Ln
- 1332 Jeppesen Ave
- 0 Cal Young Rd Unit Lot 4
- 516 Spyglass Dr
- 996 Sherwood Place
- 1943 Monterey Ln
- 1282 Evening Star Ln
- 1230 Evening Star Ln
- 1385 Hammock St
- 1355 Hammock St
- 0 Hammock St Unit 9038039
- 0 Hammock St Unit 9036996
- 0 Hammock St Unit 9036967
- 0 Hammock St Unit 9036924
- 0 Hammock St Unit 9082660
- 0 Hammock St Unit 2 9082649
- 0 Hammock St Unit 2 12391253
- 0 Hammock St Unit 12
- 1359 Hammock St
- 1349 Hammock St
- 1395 Hammock St
- 1450 Cal Young Rd
- 1345 Hammock St
- 241 Spyglass Dr
- 1378 Hammock St
- 1341 Hammock St
- 1390 Hammock St
- 1336 Spyglass Dr
Your Personal Tour Guide
Ask me questions while you tour the home.