Estimated Value: $600,000 - $705,000
5
Beds
4
Baths
1,652
Sq Ft
$399/Sq Ft
Est. Value
About This Home
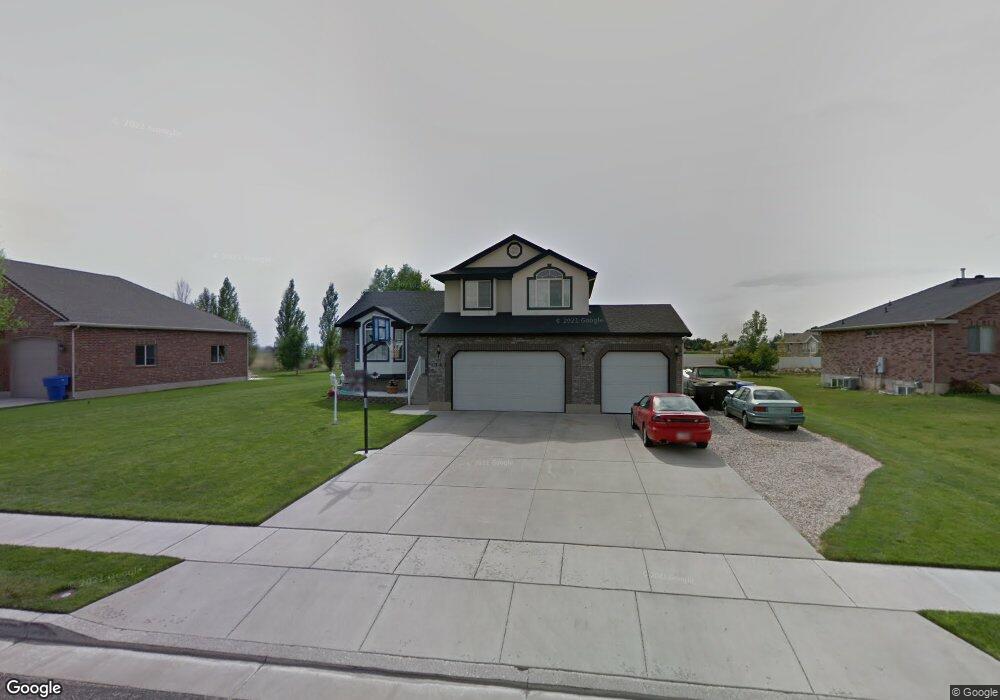
This home is located at 1367 N 4800 W, Ogden, UT 84404 and is currently estimated at $658,438, approximately $398 per square foot. 1367 N 4800 W is a home located in Weber County with nearby schools including West Weber School, Wahlquist Junior High School, and Fremont High School.
Ownership History
Date
Name
Owned For
Owner Type
Purchase Details
Closed on
Jul 10, 2003
Sold by
Mike Schultz Construction Inc
Bought by
Drysdale David A and Drysdale Penny E
Current Estimated Value
Home Financials for this Owner
Home Financials are based on the most recent Mortgage that was taken out on this home.
Original Mortgage
$173,565
Outstanding Balance
$73,569
Interest Rate
5.22%
Mortgage Type
FHA
Estimated Equity
$584,869
Purchase Details
Closed on
Mar 28, 2003
Sold by
Mountain View Title & Escrow Inc
Bought by
Mike Schultz Construction Inc
Home Financials for this Owner
Home Financials are based on the most recent Mortgage that was taken out on this home.
Original Mortgage
$136,400
Interest Rate
5.79%
Mortgage Type
Construction
Create a Home Valuation Report for This Property
The Home Valuation Report is an in-depth analysis detailing your home's value as well as a comparison with similar homes in the area
Home Values in the Area
Average Home Value in this Area
Purchase History
| Date | Buyer | Sale Price | Title Company |
|---|---|---|---|
| Drysdale David A | -- | Heritage West | |
| Mike Schultz Construction Inc | -- | Mountain View Title |
Source: Public Records
Mortgage History
| Date | Status | Borrower | Loan Amount |
|---|---|---|---|
| Open | Drysdale David A | $173,565 | |
| Previous Owner | Mike Schultz Construction Inc | $136,400 |
Source: Public Records
Tax History Compared to Growth
Tax History
| Year | Tax Paid | Tax Assessment Tax Assessment Total Assessment is a certain percentage of the fair market value that is determined by local assessors to be the total taxable value of land and additions on the property. | Land | Improvement |
|---|---|---|---|---|
| 2025 | $3,131 | $579,602 | $185,770 | $393,832 |
| 2024 | $3,131 | $313,498 | $102,175 | $211,323 |
| 2023 | $3,453 | $352,783 | $101,894 | $250,889 |
| 2022 | $3,131 | $323,950 | $90,253 | $233,697 |
| 2021 | $2,588 | $443,000 | $98,151 | $344,849 |
| 2020 | $2,311 | $359,000 | $72,204 | $286,796 |
| 2019 | $2,380 | $352,000 | $67,323 | $284,677 |
| 2018 | $2,186 | $305,000 | $67,323 | $237,677 |
| 2017 | $2,164 | $288,000 | $65,045 | $222,955 |
| 2016 | $2,143 | $156,718 | $39,436 | $117,282 |
| 2015 | $1,851 | $128,620 | $33,800 | $94,820 |
| 2014 | $1,725 | $116,252 | $33,800 | $82,452 |
Source: Public Records
Map
Nearby Homes
- 1221 N 4975 W
- 4370 W 1500 N
- 1679 N 4400 W
- 4227 W Pioneer Rd
- 1885 N 4475 W
- 2131 N 4650 W
- 1734 N 4100 St W
- 1748 N 4100 St W
- 1622 N 5900 W
- 1797 N 5900 W
- 2468 N 4350 W
- 3966 W 2200 N
- 3622 W 2200 St N Unit 23
- 2023 N 3700 W
- 155 S 4700 W
- 2520 N 4175 W
- 1663 N 3500 W
- 2388 N 3900 W
- 2690 N 4275 W
- 3594 W 2200 N Unit 3