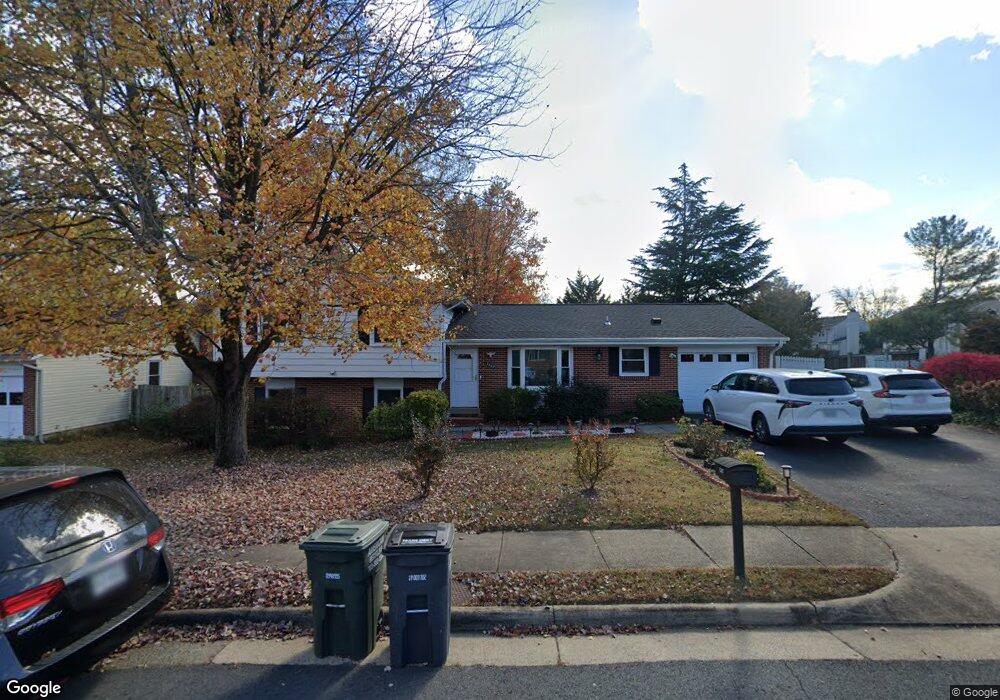
1367 Shallow Ford Rd Herndon, VA 20170
Estimated Value: $730,000 - $759,000
4
Beds
3
Baths
1,430
Sq Ft
$516/Sq Ft
Est. Value
About This Home
This home is located at 1367 Shallow Ford Rd, Herndon, VA 20170 and is currently estimated at $738,389, approximately $516 per square foot. 1367 Shallow Ford Rd is a home located in Fairfax County with nearby schools including Dranesville Elementary, Herndon Middle School, and Herndon High School.
Ownership History
Date
Name
Owned For
Owner Type
Purchase Details
Closed on
Apr 1, 2015
Sold by
Ashiq Zubair
Bought by
Ashiq Zubair
Current Estimated Value
Purchase Details
Closed on
Nov 10, 2008
Sold by
Citimortgage Inc
Bought by
Ashiq Zubair
Home Financials for this Owner
Home Financials are based on the most recent Mortgage that was taken out on this home.
Original Mortgage
$220,000
Interest Rate
6.47%
Mortgage Type
New Conventional
Purchase Details
Closed on
Aug 17, 2007
Sold by
Glasser Glasser and Glasser P L C
Bought by
Citimortgage Inc
Purchase Details
Closed on
May 5, 2005
Sold by
Stromberg Roger L
Bought by
Guzman Benjamin Delcid and Rodriguez Guvera,Ignacia D
Home Financials for this Owner
Home Financials are based on the most recent Mortgage that was taken out on this home.
Original Mortgage
$400,000
Interest Rate
6.05%
Mortgage Type
New Conventional
Create a Home Valuation Report for This Property
The Home Valuation Report is an in-depth analysis detailing your home's value as well as a comparison with similar homes in the area
Home Values in the Area
Average Home Value in this Area
Purchase History
| Date | Buyer | Sale Price | Title Company |
|---|---|---|---|
| Ashiq Zubair | -- | -- | |
| Ashiq Zubair | $275,000 | -- | |
| Citimortgage Inc | $352,533 | -- | |
| Guzman Benjamin Delcid | $500,000 | -- |
Source: Public Records
Mortgage History
| Date | Status | Borrower | Loan Amount |
|---|---|---|---|
| Previous Owner | Ashiq Zubair | $220,000 | |
| Previous Owner | Guzman Benjamin Delcid | $400,000 |
Source: Public Records
Tax History Compared to Growth
Tax History
| Year | Tax Paid | Tax Assessment Tax Assessment Total Assessment is a certain percentage of the fair market value that is determined by local assessors to be the total taxable value of land and additions on the property. | Land | Improvement |
|---|---|---|---|---|
| 2025 | $7,100 | $649,300 | $270,000 | $379,300 |
| 2024 | $7,100 | $612,830 | $255,000 | $357,830 |
| 2023 | $6,797 | $602,330 | $255,000 | $347,330 |
| 2022 | $6,511 | $569,390 | $240,000 | $329,390 |
| 2021 | $5,732 | $488,430 | $200,000 | $288,430 |
| 2020 | $5,500 | $464,690 | $190,000 | $274,690 |
| 2019 | $5,408 | $456,970 | $185,000 | $271,970 |
| 2018 | $5,136 | $446,630 | $185,000 | $261,630 |
| 2017 | $4,828 | $415,860 | $185,000 | $230,860 |
| 2016 | $4,870 | $420,410 | $185,000 | $235,410 |
| 2015 | $4,692 | $420,410 | $185,000 | $235,410 |
| 2014 | -- | $403,900 | $180,000 | $223,900 |
Source: Public Records
Map
Nearby Homes
- 1407 Skyhaven Ct
- 12546 Rock Ridge Rd
- 12406 Shallow Ford Ct
- 1551 Brownsville Dr
- 1324 Rock Chapel Rd
- 1330 Rock Chapel Rd
- 12592 Rock Ridge Rd
- 1525 Hiddenbrook Dr
- 12520 Ridgegate Dr
- 1205 Cameo Ct
- 207 N Laura Anne Dr
- 46893 Eaton Terrace Unit 300
- 1314 E Holly Ave
- 1686 Winterwood Ct
- 21845 Baldwin Square Unit 101
- 11 Butternut Way
- 46932 Courtyard Square
- 12819 Fantasia Dr
- 1107 E Beech Rd
- 113 N Harrison Rd
- 1365 Shallow Ford Rd
- 1428 Valley Mill Ct
- 1430 Valley Mill Ct
- 1364 Shallow Ford Rd
- 1363 Shallow Ford Rd
- 1426 Valley Mill Ct
- 12529 Misty Water Dr
- 1411 Skyhaven Ct
- 1432 Valley Mill Ct
- 12525 Misty Water Dr
- 1410 Skyhaven Ct
- 1361 Shallow Ford Rd
- 12531 Misty Water Dr
- 1409 Skyhaven Ct
- 12523 Misty Water Dr
- 1435 Valley Mill Ct
- 1358 Shallow Ford Rd
- 12533 Misty Water Dr
- 1408 Skyhaven Ct
- 1431 Valley Mill Ct