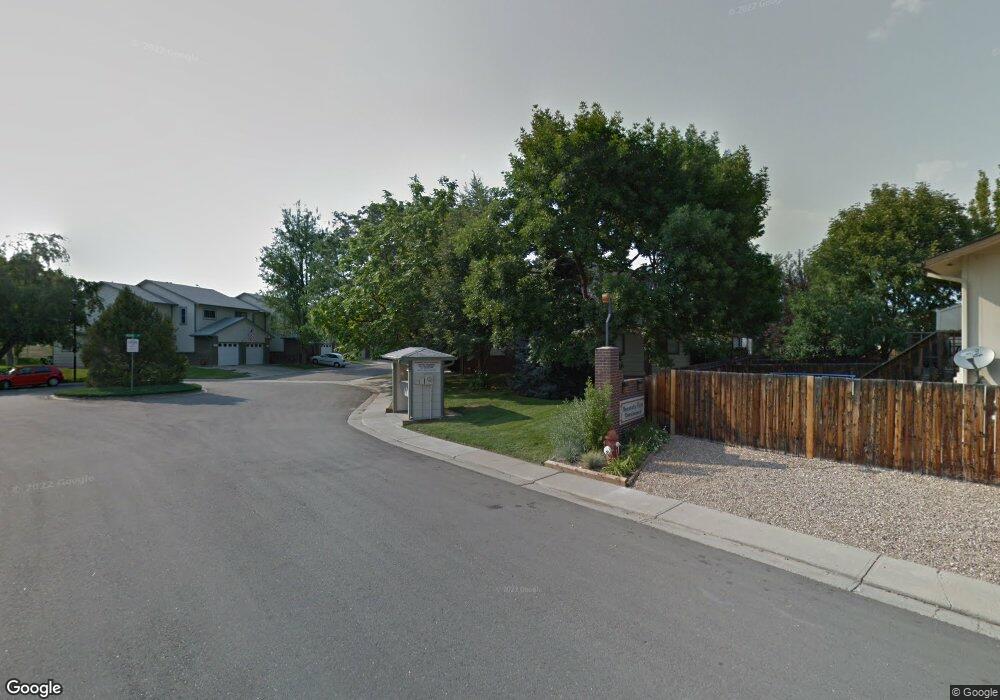
1368 Agape Way Lafayette, CO 80026
Estimated Value: $408,551 - $428,000
3
Beds
2
Baths
1,152
Sq Ft
$366/Sq Ft
Est. Value
About This Home
This home is located at 1368 Agape Way, Lafayette, CO 80026 and is currently estimated at $421,888, approximately $366 per square foot. 1368 Agape Way is a home located in Boulder County with nearby schools including Ryan Elementary School, Angevine Middle School, and Centaurus High School.
Ownership History
Date
Name
Owned For
Owner Type
Purchase Details
Closed on
Jun 30, 2000
Sold by
Mckeown Defler Alice R and Mckeown Jennifer J
Bought by
Ortman Anita L
Current Estimated Value
Home Financials for this Owner
Home Financials are based on the most recent Mortgage that was taken out on this home.
Original Mortgage
$131,500
Outstanding Balance
$48,487
Interest Rate
8.66%
Estimated Equity
$373,401
Purchase Details
Closed on
Feb 25, 2000
Sold by
Rivera Francisco G and Rivera Kathy M
Bought by
Defler Alice R
Home Financials for this Owner
Home Financials are based on the most recent Mortgage that was taken out on this home.
Original Mortgage
$103,920
Interest Rate
8.31%
Purchase Details
Closed on
Sep 29, 1992
Bought by
Ortman Anita
Purchase Details
Closed on
Apr 23, 1990
Bought by
Ortman Anita
Create a Home Valuation Report for This Property
The Home Valuation Report is an in-depth analysis detailing your home's value as well as a comparison with similar homes in the area
Home Values in the Area
Average Home Value in this Area
Purchase History
| Date | Buyer | Sale Price | Title Company |
|---|---|---|---|
| Ortman Anita L | $155,000 | -- | |
| Defler Alice R | $129,900 | Land Title | |
| Ortman Anita | $70,000 | -- | |
| Ortman Anita | $54,000 | -- |
Source: Public Records
Mortgage History
| Date | Status | Borrower | Loan Amount |
|---|---|---|---|
| Open | Ortman Anita L | $131,500 | |
| Previous Owner | Defler Alice R | $103,920 |
Source: Public Records
Tax History Compared to Growth
Tax History
| Year | Tax Paid | Tax Assessment Tax Assessment Total Assessment is a certain percentage of the fair market value that is determined by local assessors to be the total taxable value of land and additions on the property. | Land | Improvement |
|---|---|---|---|---|
| 2025 | $2,002 | $25,738 | $8,994 | $16,744 |
| 2024 | $2,002 | $25,738 | $8,994 | $16,744 |
| 2023 | $1,968 | $22,592 | $8,991 | $17,286 |
| 2022 | $2,030 | $21,608 | $7,020 | $14,588 |
| 2021 | $2,008 | $22,230 | $7,222 | $15,008 |
| 2020 | $1,953 | $21,372 | $5,792 | $15,580 |
| 2019 | $1,926 | $21,372 | $5,792 | $15,580 |
| 2018 | $1,679 | $18,396 | $5,544 | $12,852 |
| 2017 | $1,635 | $20,338 | $6,129 | $14,209 |
| 2016 | $1,356 | $14,774 | $4,458 | $10,316 |
| 2015 | $1,271 | $12,514 | $3,264 | $9,250 |
| 2014 | $1,082 | $12,514 | $3,264 | $9,250 |
Source: Public Records
Map
Nearby Homes
- 1400 Agape Way
- 1065 Delta Dr Unit C
- 1065 Delta Dr Unit A
- 1053 Delta Dr Unit B
- 1117 Elysian Field Dr Unit B
- 1111 Elysian Field Dr Unit D
- 1116 Elysian Field Dr Unit F
- 1407 Lydia Dr Unit 61
- 1711 Cato Cir Unit 21
- 1245 Ceres Dr
- 1805 Chalcis Dr Unit A39
- 1418 Marigold Dr
- 1892 Centaur Cir
- 1191 Milo Cir Unit A
- 805 Argos Cir
- 2034 Gyros Cir Unit 153
- 1045 Milo Cir Unit A
- 1198 Milo Cir Unit A
- 1091 Milo Cir Unit B
- 911 Homer Cir
- 1366 Agape Way
- 1364 Agape Way
- 1362 Agape Way
- 1360 Agape Way
- 25 Centaur Ct
- 20 Centaur Ct
- 1330 Agape Way
- 1379 Agape Way
- 1328 Agape Way
- 1500 Centaur Ct
- 1377 Agape Way
- 1375 Agape Way
- 1520 Centaur Ct
- 1530 Centaur Ct
- 1510 Centaur Ct
- 1326 Agape Way
- 1326 Agape Way Unit 8
- 1391 Agape Way
- 1359 Agape Way
- 7680 Frontage Rd