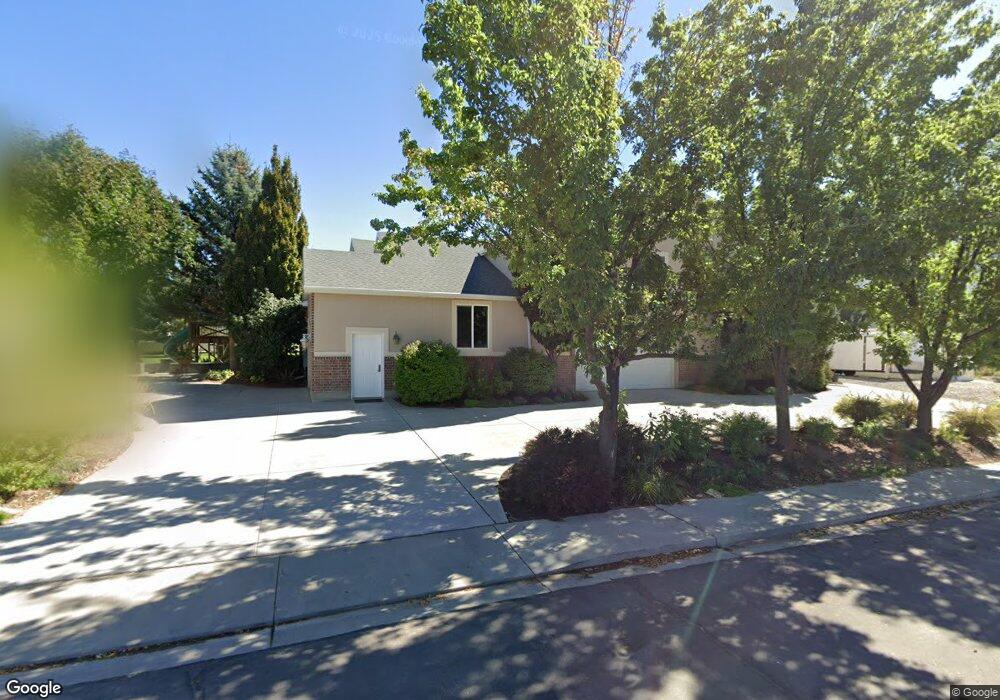
1368 N 200 W Mapleton, UT 84664
Estimated Value: $1,616,000 - $2,174,744
2
Beds
6
Baths
15,589
Sq Ft
$122/Sq Ft
Est. Value
About This Home
This home is located at 1368 N 200 W, Mapleton, UT 84664 and is currently estimated at $1,895,372, approximately $121 per square foot. 1368 N 200 W is a home located in Utah County with nearby schools including Hobble Creek School, Mapleton Junior High School, and Maple Mountain High School.
Ownership History
Date
Name
Owned For
Owner Type
Purchase Details
Closed on
Mar 2, 2026
Sold by
Lamont Craig and Lamont Diane Bagley
Bought by
Craig Roy Lamont Marital And Family Trust and Diane Bagley Lamont Marital And Family Trust
Current Estimated Value
Home Financials for this Owner
Home Financials are based on the most recent Mortgage that was taken out on this home.
Original Mortgage
$927,363
Outstanding Balance
$927,363
Interest Rate
5.75%
Mortgage Type
New Conventional
Estimated Equity
$968,009
Purchase Details
Closed on
Oct 23, 2023
Sold by
Lamont Craig Roy and Lamont Diane
Bought by
Craig Roy Lamont Marital And Family Trust and Lamont
Home Financials for this Owner
Home Financials are based on the most recent Mortgage that was taken out on this home.
Original Mortgage
$950,300
Interest Rate
7.18%
Mortgage Type
New Conventional
Purchase Details
Closed on
Feb 19, 2015
Sold by
Lamont Carig Roy and Lamont Diane Bagley
Bought by
The Craig Roy Lamont Marital And Family
Home Financials for this Owner
Home Financials are based on the most recent Mortgage that was taken out on this home.
Original Mortgage
$477,500
Interest Rate
3.66%
Mortgage Type
Credit Line Revolving
Purchase Details
Closed on
Aug 29, 1996
Sold by
Keuhl David and Keuhl Julia
Bought by
Black Preston T
Home Financials for this Owner
Home Financials are based on the most recent Mortgage that was taken out on this home.
Original Mortgage
$117,025
Interest Rate
8.2%
Mortgage Type
FHA
Create a Home Valuation Report for This Property
The Home Valuation Report is an in-depth analysis detailing your home's value as well as a comparison with similar homes in the area
Home Values in the Area
Average Home Value in this Area
Purchase History
| Date | Buyer | Sale Price | Title Company |
|---|---|---|---|
| Craig Roy Lamont Marital And Family Trust | -- | Northern Title Company | |
| Lamont Craig | -- | Northern Title Company | |
| Craig Roy Lamont Marital And Family Trust | -- | Stewart Title | |
| Lamont Craig Roy | -- | Stewart Title | |
| The Craig Roy Lamont Marital And Family | -- | Meridian Title Co | |
| Lamont Carig Roy | -- | Meridian Title Co | |
| Black Preston T | -- | -- |
Source: Public Records
Mortgage History
| Date | Status | Borrower | Loan Amount |
|---|---|---|---|
| Open | Lamont Craig | $927,363 | |
| Previous Owner | Lamont Craig Roy | $950,300 | |
| Previous Owner | Lamont Carig Roy | $477,500 | |
| Previous Owner | The Craig Roy Lamont Marital And Family | $256,498 | |
| Previous Owner | Black Preston T | $117,025 |
Source: Public Records
Tax History
| Year | Tax Paid | Tax Assessment Tax Assessment Total Assessment is a certain percentage of the fair market value that is determined by local assessors to be the total taxable value of land and additions on the property. | Land | Improvement |
|---|---|---|---|---|
| 2025 | $9,273 | $1,043,760 | -- | -- |
| 2024 | $9,273 | $908,370 | $0 | $0 |
| 2023 | $10,338 | $1,019,150 | $0 | $0 |
| 2022 | $12,512 | $2,195,400 | $384,900 | $1,810,500 |
| 2021 | $11,063 | $1,638,000 | $245,300 | $1,392,700 |
| 2020 | $10,552 | $1,512,100 | $216,800 | $1,295,300 |
| 2019 | $10,283 | $1,504,100 | $208,800 | $1,295,300 |
| 2018 | $9,460 | $1,318,100 | $175,300 | $1,142,800 |
| 2017 | $8,615 | $643,135 | $0 | $0 |
| 2016 | $7,616 | $565,155 | $0 | $0 |
| 2015 | $7,551 | $556,905 | $0 | $0 |
| 2014 | $6,747 | $488,670 | $0 | $0 |
Source: Public Records
Map
Nearby Homes
- 1350 N Main St
- 897 N Main St
- 145 W Carnesecca Ct
- 1697 N 500 W
- 598 W 1600 N
- 435 E 1000 N
- 667 N 550 W
- 405 W 1200 N Unit 4
- 487 W 1200 N Unit 1
- 265 E 600 N
- 594 E 1000 N
- 1567 N 600 E Unit 26
- 84 E 530 N
- 572 W 500 N
- 648 W 400 N
- 754 W 400 N Unit 29
- 1264 E 1150 S
- 775 N 800 E
- 1618 E 970 S
- 1839 River Bottom Rd
Your Personal Tour Guide
Ask me questions while you tour the home.