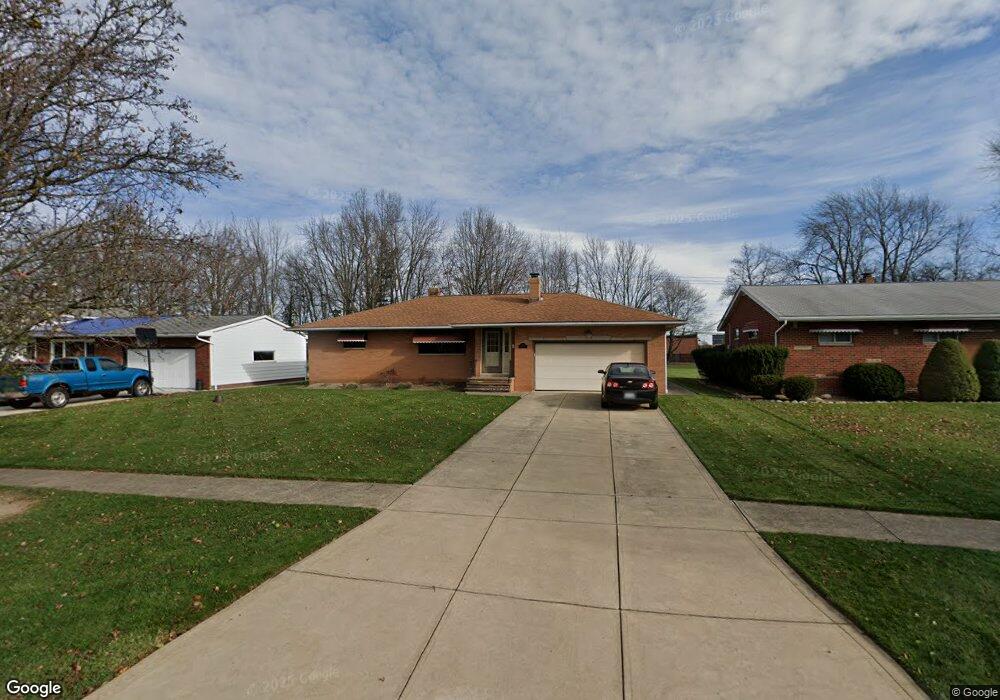
13682 Mohawk Trail Middleburg Heights, OH 44130
Estimated Value: $272,041 - $316,000
3
Beds
2
Baths
1,513
Sq Ft
$193/Sq Ft
Est. Value
About This Home
This home is located at 13682 Mohawk Trail, Middleburg Heights, OH 44130 and is currently estimated at $291,260, approximately $192 per square foot. 13682 Mohawk Trail is a home located in Cuyahoga County with nearby schools including Big Creek Elementary School, Berea-Midpark Middle School, and Berea-Midpark High School.
Ownership History
Date
Name
Owned For
Owner Type
Purchase Details
Closed on
Aug 18, 2000
Sold by
Repjar Andrew G
Bought by
Nadeo James L and Dimarino Sonya
Current Estimated Value
Home Financials for this Owner
Home Financials are based on the most recent Mortgage that was taken out on this home.
Original Mortgage
$132,600
Outstanding Balance
$47,740
Interest Rate
8.12%
Estimated Equity
$243,520
Purchase Details
Closed on
Jul 20, 2000
Sold by
Estate Of Margaret S Repjar
Bought by
Repjat Andrew G
Home Financials for this Owner
Home Financials are based on the most recent Mortgage that was taken out on this home.
Original Mortgage
$132,600
Outstanding Balance
$47,740
Interest Rate
8.12%
Estimated Equity
$243,520
Purchase Details
Closed on
Jul 22, 1981
Sold by
Repjar Andrew
Bought by
Repjar Andrew
Purchase Details
Closed on
Jun 15, 1981
Sold by
Repjar Andrew and Repjar Susan
Bought by
Repjar Andrew
Purchase Details
Closed on
Jan 1, 1975
Bought by
Repjar Andrew and Repjar Susan
Create a Home Valuation Report for This Property
The Home Valuation Report is an in-depth analysis detailing your home's value as well as a comparison with similar homes in the area
Home Values in the Area
Average Home Value in this Area
Purchase History
| Date | Buyer | Sale Price | Title Company |
|---|---|---|---|
| Nadeo James L | $156,000 | Insignia Title Agency Ltd | |
| Repjat Andrew G | -- | -- | |
| Repjar Andrew | -- | -- | |
| Repjar Andrew | -- | -- | |
| Repjar Andrew | -- | -- |
Source: Public Records
Mortgage History
| Date | Status | Borrower | Loan Amount |
|---|---|---|---|
| Open | Nadeo James L | $132,600 |
Source: Public Records
Tax History Compared to Growth
Tax History
| Year | Tax Paid | Tax Assessment Tax Assessment Total Assessment is a certain percentage of the fair market value that is determined by local assessors to be the total taxable value of land and additions on the property. | Land | Improvement |
|---|---|---|---|---|
| 2024 | $4,361 | $82,460 | $21,490 | $60,970 |
| 2023 | $4,167 | $65,100 | $15,190 | $49,910 |
| 2022 | $4,139 | $65,100 | $15,190 | $49,910 |
| 2021 | $4,116 | $65,100 | $15,190 | $49,910 |
| 2020 | $4,034 | $56,110 | $13,090 | $43,020 |
| 2019 | $3,920 | $160,300 | $37,400 | $122,900 |
| 2018 | $3,742 | $56,110 | $13,090 | $43,020 |
| 2017 | $3,860 | $51,210 | $14,250 | $36,960 |
| 2016 | $3,830 | $51,210 | $14,250 | $36,960 |
| 2015 | $3,414 | $51,210 | $14,250 | $36,960 |
| 2014 | $3,414 | $48,300 | $13,440 | $34,860 |
Source: Public Records
Map
Nearby Homes
- 6943 N Parkway Dr Unit H6943
- 6988 Maplewood Rd
- 7330 Maplewood Rd
- 7316 Oakwood Rd
- 12990 Bagley Rd
- 7230 Greenleaf Ave
- 13689 Pineview Ct
- 12939 W Pleasant Valley Rd
- 6771 Wood Creek Dr
- 13493 Pineview Ct
- 7280 Pearl Rd
- 6767 Greenleaf Ave
- 6640 Pearl Rd Unit 402
- 7446 Pinewood Dr
- V/L Franke Rd
- 14280 Pawnee Trail
- 13765 Newton Rd
- 6749 Middlebrook Blvd
- 6682 Parma Park Blvd
- 7364 Pearl Rd
- 13702 Mohawk Trail
- 13660 Mohawk Trail
- 13724 Mohawk Trail
- 13640 Mohawk Trail
- 13681 Mohawk Trail
- 13659 Mohawk Trail
- 13703 Mohawk Trail
- 13618 Mohawk Trail
- 13746 Mohawk Trail
- 13641 Mohawk Trail
- 13731 Mohawk Trail
- 13768 Mohawk Trail
- 13617 Mohawk Trail
- 13598 Mohawk Trail
- 13599 Mohawk Trail
- 13576 Mohawk Trail
- 13790 Mohawk Trail
- 13753 Mohawk Trail
- 13577 Mohawk Trail
- 13797 Mohawk Trail