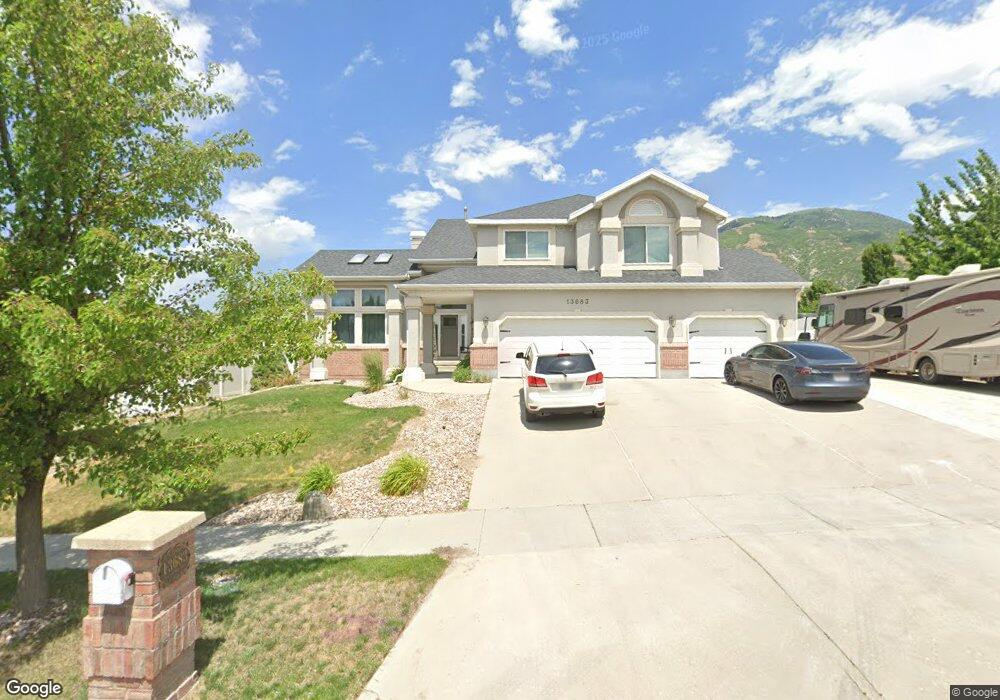
13683 Hackamore Dr Draper, UT 84020
Estimated Value: $1,077,000 - $1,217,000
6
Beds
5
Baths
3,597
Sq Ft
$328/Sq Ft
Est. Value
About This Home
This home is located at 13683 Hackamore Dr, Draper, UT 84020 and is currently estimated at $1,181,006, approximately $328 per square foot. 13683 Hackamore Dr is a home located in Salt Lake County with nearby schools including Draper Elementary School, Draper Park Middle School, and Corner Canyon High School.
Ownership History
Date
Name
Owned For
Owner Type
Purchase Details
Closed on
Aug 20, 2020
Sold by
Nash Glen A and Nash Tammy
Bought by
Marshall Theodore and Marshall Darcy
Current Estimated Value
Home Financials for this Owner
Home Financials are based on the most recent Mortgage that was taken out on this home.
Original Mortgage
$589,000
Outstanding Balance
$517,759
Interest Rate
3%
Mortgage Type
New Conventional
Estimated Equity
$663,247
Purchase Details
Closed on
Nov 21, 1996
Sold by
Nash Glen A and Nash Glenn
Bought by
Nash Glen A and Nash Tammy
Home Financials for this Owner
Home Financials are based on the most recent Mortgage that was taken out on this home.
Original Mortgage
$250,000
Interest Rate
7.91%
Purchase Details
Closed on
Feb 15, 1994
Sold by
Corner Canyon L C
Bought by
Nash Glenn and Nash Tammy
Purchase Details
Closed on
Jan 20, 1994
Sold by
Corner Canyon Lc
Bought by
Nash Glenn and Nash Tammy
Create a Home Valuation Report for This Property
The Home Valuation Report is an in-depth analysis detailing your home's value as well as a comparison with similar homes in the area
Home Values in the Area
Average Home Value in this Area
Purchase History
| Date | Buyer | Sale Price | Title Company |
|---|---|---|---|
| Marshall Theodore | -- | Meridian Title | |
| Nash Glen A | -- | -- | |
| Nash Glenn | -- | -- | |
| Nash Glenn | -- | -- |
Source: Public Records
Mortgage History
| Date | Status | Borrower | Loan Amount |
|---|---|---|---|
| Open | Marshall Theodore | $589,000 | |
| Previous Owner | Nash Glen A | $250,000 |
Source: Public Records
Tax History
| Year | Tax Paid | Tax Assessment Tax Assessment Total Assessment is a certain percentage of the fair market value that is determined by local assessors to be the total taxable value of land and additions on the property. | Land | Improvement |
|---|---|---|---|---|
| 2025 | $5,210 | $1,035,300 | $288,900 | $746,400 |
| 2024 | $5,210 | $995,300 | $277,900 | $717,400 |
| 2023 | $5,210 | $949,000 | $275,000 | $674,000 |
| 2022 | $5,357 | $981,100 | $269,600 | $711,500 |
| 2021 | $5,093 | $796,900 | $207,400 | $589,500 |
| 2020 | $4,116 | $610,500 | $197,000 | $413,500 |
| 2019 | $4,107 | $595,200 | $188,700 | $406,500 |
| 2018 | $3,707 | $549,100 | $188,700 | $360,400 |
| 2017 | $3,525 | $500,200 | $188,700 | $311,500 |
| 2016 | $3,473 | $478,900 | $188,700 | $290,200 |
| 2015 | $3,802 | $485,400 | $163,100 | $322,300 |
| 2014 | $3,650 | $455,300 | $153,900 | $301,400 |
Source: Public Records
Map
Nearby Homes
- 13818 S Vestry Rd Unit 59
- 14013 S Pine Mesa Dr
- 963 Old English Rd
- 919 E 13800 S
- 13216 S Telemark Ln
- 14119 S Senior Band Rd
- 1709 E Richey Rd
- 13050 S 1300 E
- 1536 Lantern Ln
- 13543 S Aintree Ave
- 14133 S Spyglass Hill Dr
- 14146 S Spyglass Hill Dr
- 1518 Stanford Ct
- 12959 S Fort St
- 528 E 13710 S
- 13898 Summerset Cir
- 1154 E Sunset Dunes Way
- 1139 E Sunscape Ln
- 13520 S Lone Rock Dr
- 1370 E Meadow Valley Dr
- 13683 S Hackamore Dr
- 13673 Hackamore Dr
- 13693 S Hackamore Dr
- 13658 S Bridle Trail Rd
- 13658 Bridle Trail Rd
- 13648 Bridle Trail Rd
- 13672 Bridle Trail Rd
- 13672 S Bridle Trail Rd
- 13692 Hackamore Dr
- 13672 Hackamore Dr
- 13661 Hackamore Dr
- 13682 Hackamore Dr
- 13702 S Hackamore Dr
- 13702 Hackamore Dr
- 13636 S Bridle Trail Rd
- 13636 Bridle Trail Rd
- 13666 Hackamore Dr
- 13666 S Hackamore Dr
- 13651 Hackamore Dr
- 13717 S Hackamore Cir
Your Personal Tour Guide
Ask me questions while you tour the home.