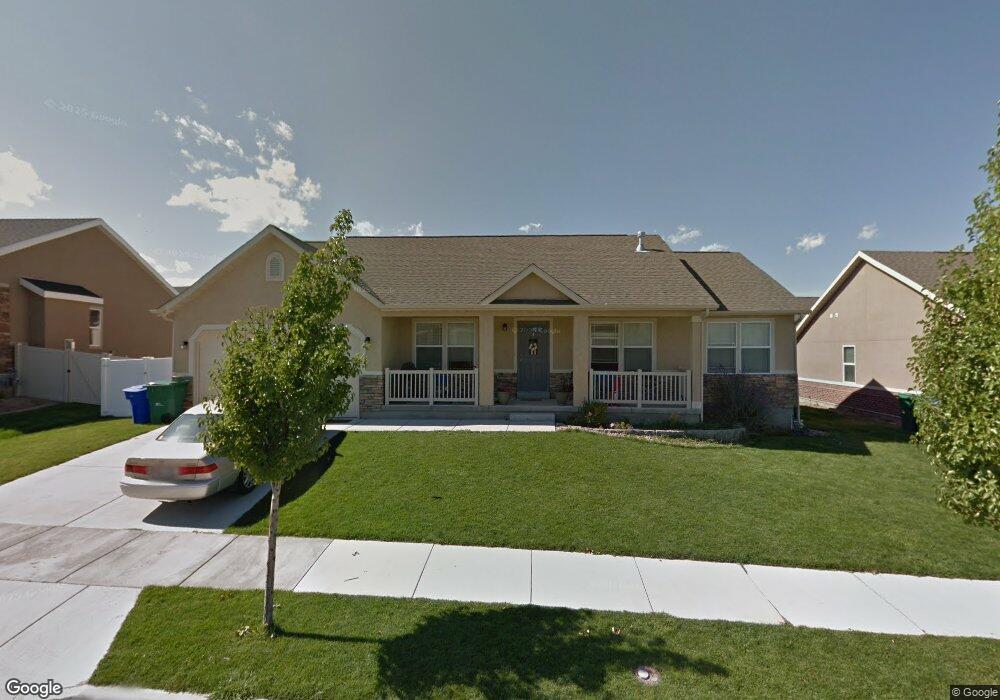
13686 Daggerwing Way Riverton, UT 84096
Estimated Value: $532,000 - $639,000
3
Beds
2
Baths
1,866
Sq Ft
$319/Sq Ft
Est. Value
About This Home
This home is located at 13686 Daggerwing Way, Riverton, UT 84096 and is currently estimated at $594,658, approximately $318 per square foot. 13686 Daggerwing Way is a home located in Salt Lake County with nearby schools including Foothills School, South Hills Middle School, and Mountain Ridge High School.
Ownership History
Date
Name
Owned For
Owner Type
Purchase Details
Closed on
Jun 16, 2015
Sold by
Freeman Matthew E and Freeman Shanae R
Bought by
Freeman Fmily Trust
Current Estimated Value
Purchase Details
Closed on
Aug 24, 2012
Sold by
Freeman Matthew E and Freeman Shanae R
Bought by
Freeman Matthew E and Freeman Shanae R
Purchase Details
Closed on
Apr 22, 2009
Sold by
Freeman Matthew E and Freeman Shanae R
Bought by
Freeman Matthew E and Freeman Shanae R
Purchase Details
Closed on
Aug 29, 2005
Sold by
Centex Homes
Bought by
Freeman Matthew E and Freeman Shanae R
Home Financials for this Owner
Home Financials are based on the most recent Mortgage that was taken out on this home.
Original Mortgage
$13,796
Interest Rate
5.18%
Mortgage Type
Stand Alone Second
Create a Home Valuation Report for This Property
The Home Valuation Report is an in-depth analysis detailing your home's value as well as a comparison with similar homes in the area
Home Values in the Area
Average Home Value in this Area
Purchase History
| Date | Buyer | Sale Price | Title Company |
|---|---|---|---|
| Freeman Fmily Trust | -- | Accommodation | |
| Freeman Matthew E | -- | None Available | |
| Freeman Matthew E | -- | None Available | |
| Freeman Matthew E | -- | First American Title |
Source: Public Records
Mortgage History
| Date | Status | Borrower | Loan Amount |
|---|---|---|---|
| Closed | Freeman Matthew E | $13,796 | |
| Open | Freeman Matthew E | $166,204 |
Source: Public Records
Tax History
| Year | Tax Paid | Tax Assessment Tax Assessment Total Assessment is a certain percentage of the fair market value that is determined by local assessors to be the total taxable value of land and additions on the property. | Land | Improvement |
|---|---|---|---|---|
| 2025 | $3,234 | $579,200 | $131,900 | $447,300 |
| 2024 | $3,234 | $559,700 | $127,300 | $432,400 |
| 2023 | $226 | $520,400 | $111,700 | $408,700 |
| 2022 | $226 | $532,300 | $109,500 | $422,800 |
| 2021 | $882 | $403,600 | $84,300 | $319,300 |
| 2020 | $2,762 | $367,000 | $84,300 | $282,700 |
| 2019 | $2,728 | $356,300 | $84,300 | $272,000 |
| 2016 | $2,442 | $293,700 | $78,700 | $215,000 |
Source: Public Records
Map
Nearby Homes
- 13626 S Bluewing Way
- 13578 S Buckeye View Way
- 13597 S Firetip Ct
- 5087 W London Bay Dr
- 5092 W London Bay Dr
- 13503 S Leaf Wing Ln
- 13830 S Little Water Peak Dr
- 6652 13400 S
- 13397 S Alto Vista Ln
- 13377 S Vitasol Ln
- 13392 S Alto Vista Ln
- 13941 S 4960 W
- 5244 W Shaggy Peak Dr
- 5149 W Arley Ct
- 13324 S Ashurst Ln
- 13343 S Fallowfield Ln
- 5168 W Shady Park Ln
- 4722 W Cillian Ln Unit 2411
- 4714 W Cillian Ln Unit 2410
- 4688 W Cillian Ln Unit 2408
- 13696 S Daggerwing Way
- 13696 Daggerwing Way
- 13678 S Daggerwing Way
- 13678 Daggerwing Way
- 13671 S Bluewing Way
- 13671 Bluewing Way
- 13681 S Bluewing Way
- 13681 Bluewing Way
- 13661 S Bluewing Way
- 13661 Bluewing Way
- 13693 Daggerwing Way
- 13693 S Daggerwing Way
- 13683 S Daggerwing Way
- 13683 Daggerwing Way
- 13708 S Daggerwing Way
- 13708 Daggerwing Way
- 13697 Bluewing Way
- 13703 Daggerwing Way
- 13707 Bluewing Way
- 13713 Daggerwing Way
Your Personal Tour Guide
Ask me questions while you tour the home.