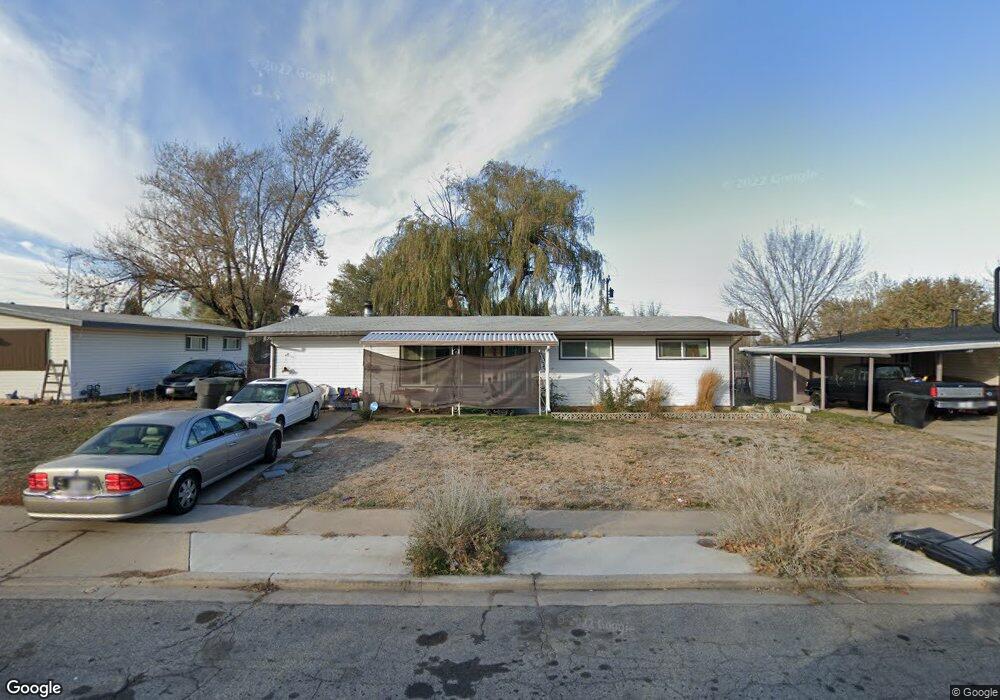
1369 N 350 W Clearfield, UT 84015
Estimated Value: $357,000 - $379,000
3
Beds
1
Bath
1,352
Sq Ft
$274/Sq Ft
Est. Value
About This Home
This home is located at 1369 N 350 W, Clearfield, UT 84015 and is currently estimated at $370,642, approximately $274 per square foot. 1369 N 350 W is a home located in Davis County with nearby schools including Sunset School, Sunset Junior High School, and Northridge High School.
Ownership History
Date
Name
Owned For
Owner Type
Purchase Details
Closed on
Oct 15, 2019
Sold by
Miller Billy G
Bought by
Miller Billy G and Vega Michelle
Current Estimated Value
Home Financials for this Owner
Home Financials are based on the most recent Mortgage that was taken out on this home.
Original Mortgage
$218,000
Outstanding Balance
$189,731
Interest Rate
3.4%
Mortgage Type
VA
Estimated Equity
$180,911
Purchase Details
Closed on
Nov 16, 2018
Sold by
Kahn David
Bought by
Kahn David and Kahn Andrea M
Purchase Details
Closed on
Sep 3, 2016
Sold by
Kahn David
Bought by
Mallett Theola and Mallett Theola B
Purchase Details
Closed on
Apr 30, 2012
Sold by
Lund Carol Ann
Bought by
Mallett Theola B
Home Financials for this Owner
Home Financials are based on the most recent Mortgage that was taken out on this home.
Original Mortgage
$96,002
Interest Rate
3.87%
Mortgage Type
FHA
Purchase Details
Closed on
Oct 15, 1999
Sold by
Johnson James W and Johnson Erma E
Bought by
Johnson James W and Johnson Erma E
Create a Home Valuation Report for This Property
The Home Valuation Report is an in-depth analysis detailing your home's value as well as a comparison with similar homes in the area
Home Values in the Area
Average Home Value in this Area
Purchase History
| Date | Buyer | Sale Price | Title Company |
|---|---|---|---|
| Miller Billy G | -- | Mountain View Title & Es | |
| Miller Billy G | -- | Backman Title Service | |
| Kahn David | -- | Vanguard Title Ins Union Par | |
| Mallett Theola | -- | Security Title | |
| Mallett Theola B | -- | Bonneville Superior | |
| Johnson James W | -- | -- |
Source: Public Records
Mortgage History
| Date | Status | Borrower | Loan Amount |
|---|---|---|---|
| Open | Miller Billy G | $218,000 | |
| Previous Owner | Mallett Theola B | $96,002 | |
| Previous Owner | Mallett Theola B | $5,700 |
Source: Public Records
Tax History Compared to Growth
Tax History
| Year | Tax Paid | Tax Assessment Tax Assessment Total Assessment is a certain percentage of the fair market value that is determined by local assessors to be the total taxable value of land and additions on the property. | Land | Improvement |
|---|---|---|---|---|
| 2025 | $1,954 | $178,200 | $73,199 | $105,001 |
| 2024 | $1,935 | $176,550 | $69,974 | $106,576 |
| 2023 | $1,798 | $299,000 | $111,892 | $187,108 |
| 2022 | $1,924 | $173,250 | $64,099 | $109,151 |
| 2021 | $1,689 | $239,000 | $68,463 | $170,537 |
| 2020 | $1,466 | $204,000 | $57,655 | $146,345 |
| 2019 | $1,212 | $173,000 | $74,222 | $98,778 |
| 2018 | $1,074 | $150,000 | $59,315 | $90,685 |
| 2016 | $915 | $65,671 | $27,715 | $37,956 |
| 2015 | $873 | $59,346 | $27,715 | $31,631 |
| 2014 | $840 | $58,375 | $28,159 | $30,216 |
| 2013 | -- | $53,974 | $23,265 | $30,709 |
Source: Public Records
Map
Nearby Homes