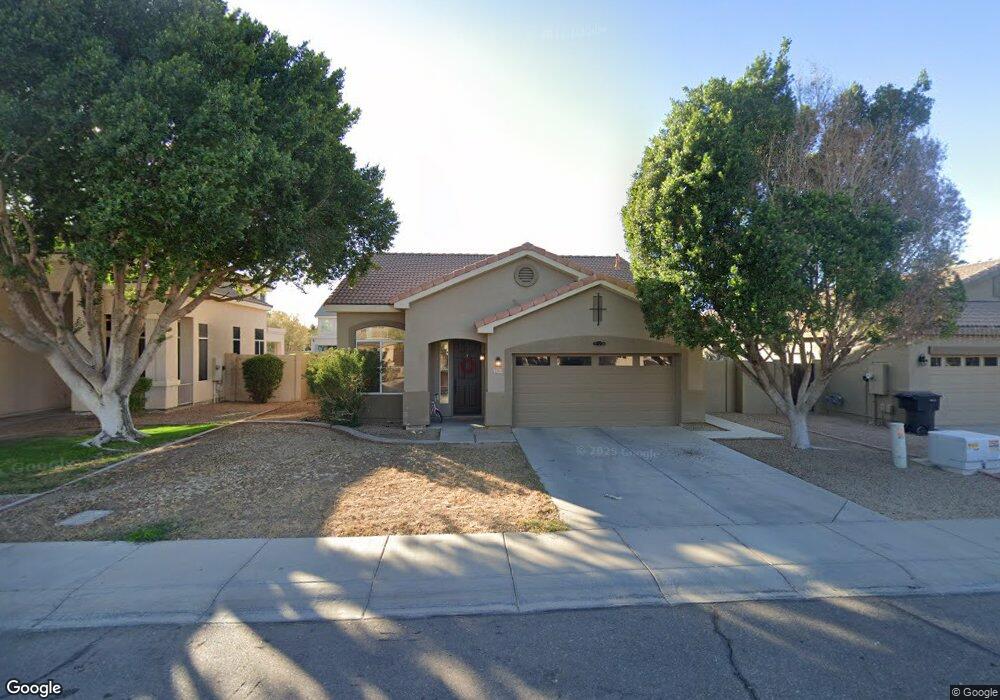
1369 W Enfield Way Chandler, AZ 85286
Central Chandler NeighborhoodEstimated Value: $433,836 - $546,000
--
Bed
3
Baths
1,627
Sq Ft
$306/Sq Ft
Est. Value
About This Home
This home is located at 1369 W Enfield Way, Chandler, AZ 85286 and is currently estimated at $497,959, approximately $306 per square foot. 1369 W Enfield Way is a home located in Maricopa County with nearby schools including Jacobson Elementary School, Bogle Junior High School, and Hamilton High School.
Ownership History
Date
Name
Owned For
Owner Type
Purchase Details
Closed on
Jul 8, 2016
Sold by
Solomon Michael and Tesfaye Martha
Bought by
Solomon Michael and Tesfaye Martha
Current Estimated Value
Home Financials for this Owner
Home Financials are based on the most recent Mortgage that was taken out on this home.
Original Mortgage
$195,000
Outstanding Balance
$88,645
Interest Rate
3.64%
Mortgage Type
New Conventional
Estimated Equity
$409,314
Purchase Details
Closed on
Mar 10, 1999
Sold by
Moore Shannon L
Bought by
Solomon Michael
Home Financials for this Owner
Home Financials are based on the most recent Mortgage that was taken out on this home.
Original Mortgage
$132,567
Interest Rate
6.73%
Mortgage Type
FHA
Purchase Details
Closed on
Jul 16, 1997
Sold by
Fulton Homes Corp
Bought by
Moore Shannon L
Home Financials for this Owner
Home Financials are based on the most recent Mortgage that was taken out on this home.
Original Mortgage
$118,250
Interest Rate
7.5%
Mortgage Type
New Conventional
Create a Home Valuation Report for This Property
The Home Valuation Report is an in-depth analysis detailing your home's value as well as a comparison with similar homes in the area
Home Values in the Area
Average Home Value in this Area
Purchase History
| Date | Buyer | Sale Price | Title Company |
|---|---|---|---|
| Solomon Michael | -- | None Available | |
| Solomon Michael | $136,500 | Capital Title Agency | |
| Moore Shannon L | $124,475 | Security Title |
Source: Public Records
Mortgage History
| Date | Status | Borrower | Loan Amount |
|---|---|---|---|
| Open | Solomon Michael | $195,000 | |
| Closed | Solomon Michael | $132,567 | |
| Previous Owner | Moore Shannon L | $118,250 |
Source: Public Records
Tax History Compared to Growth
Tax History
| Year | Tax Paid | Tax Assessment Tax Assessment Total Assessment is a certain percentage of the fair market value that is determined by local assessors to be the total taxable value of land and additions on the property. | Land | Improvement |
|---|---|---|---|---|
| 2025 | $2,199 | $23,517 | -- | -- |
| 2024 | $2,122 | $22,398 | -- | -- |
| 2023 | $2,122 | $37,460 | $7,490 | $29,970 |
| 2022 | $2,055 | $28,200 | $5,640 | $22,560 |
| 2021 | $2,113 | $26,670 | $5,330 | $21,340 |
| 2020 | $2,101 | $24,320 | $4,860 | $19,460 |
| 2019 | $2,027 | $23,130 | $4,620 | $18,510 |
| 2018 | $1,969 | $22,050 | $4,410 | $17,640 |
| 2017 | $1,850 | $21,370 | $4,270 | $17,100 |
| 2016 | $1,787 | $20,550 | $4,110 | $16,440 |
| 2015 | $1,714 | $18,520 | $3,700 | $14,820 |
Source: Public Records
Map
Nearby Homes
- 1429 W Enfield Way
- 1700 S Navajo Way
- 1405 W Musket Way
- 1144 W Enfield Place
- 1574 W Maplewood St
- 1963 S Navajo Way
- 1605 S Ash Dr
- 1627 W Maplewood St
- 1511 W Wildhorse Ct
- 1563 S Pennington Dr
- 2073 S Navajo Ct
- 1694 S Villas Ln
- 1419 W Homestead Ct
- 2100 S Sycamore St
- 1831 W Armstrong Way
- 1838 W Enfield Way
- 1751 W Mulberry Dr
- 1470 S Villas Ct
- 1770 W Mulberry Dr
- 1874 W Musket Way
- 1379 W Enfield Way
- 1359 W Enfield Way
- 1389 W Enfield Way
- 1349 W Enfield Way
- 1370 W Armstrong Way
- 1360 W Armstrong Way
- 1380 W Armstrong Way
- 1350 W Armstrong Way
- 1399 W Enfield Way
- 1378 W Enfield Way
- 1368 W Enfield Way
- 1339 W Enfield Way
- 1390 W Armstrong Way
- 1388 W Enfield Way
- 1358 W Enfield Way
- 1340 W Armstrong Way
- 1400 W Armstrong Way
- 1348 W Enfield Way
- 1398 W Enfield Way
- 1409 W Enfield Way