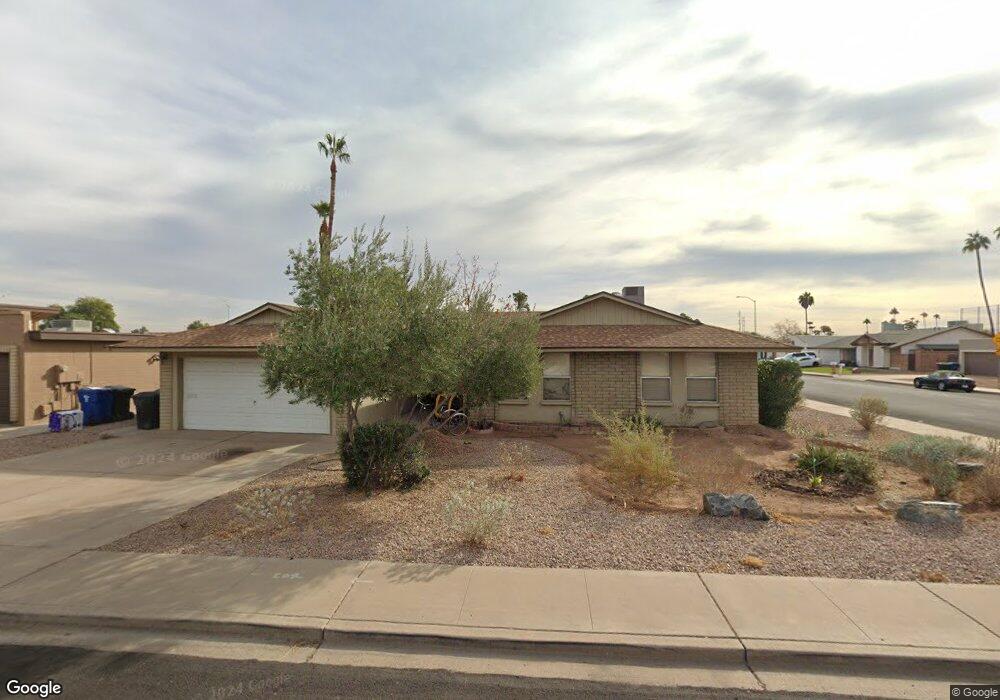
1369 W Onza Ave Mesa, AZ 85202
Dobson NeighborhoodEstimated Value: $423,854 - $498,000
3
Beds
2
Baths
1,480
Sq Ft
$307/Sq Ft
Est. Value
About This Home
This home is located at 1369 W Onza Ave, Mesa, AZ 85202 and is currently estimated at $454,214, approximately $306 per square foot. 1369 W Onza Ave is a home located in Maricopa County with nearby schools including Franklin at Brimhall Elementary School, Summit Academy Elementary, and Franklin Accelerated Academy Jordan Campus.
Ownership History
Date
Name
Owned For
Owner Type
Purchase Details
Closed on
Oct 10, 2012
Sold by
Gillespie Amy J
Bought by
Onzammy Properties Llc
Current Estimated Value
Home Financials for this Owner
Home Financials are based on the most recent Mortgage that was taken out on this home.
Original Mortgage
$132,300
Outstanding Balance
$91,915
Interest Rate
3.58%
Mortgage Type
New Conventional
Estimated Equity
$362,299
Purchase Details
Closed on
Oct 9, 2012
Sold by
Marcus Samuel B
Bought by
Gillesple Amy J
Home Financials for this Owner
Home Financials are based on the most recent Mortgage that was taken out on this home.
Original Mortgage
$132,300
Outstanding Balance
$91,915
Interest Rate
3.58%
Mortgage Type
New Conventional
Estimated Equity
$362,299
Purchase Details
Closed on
Oct 6, 2012
Sold by
Onzammy Properties Llc
Bought by
Gillesple Amy J
Home Financials for this Owner
Home Financials are based on the most recent Mortgage that was taken out on this home.
Original Mortgage
$132,300
Outstanding Balance
$91,915
Interest Rate
3.58%
Mortgage Type
New Conventional
Estimated Equity
$362,299
Purchase Details
Closed on
Apr 8, 2009
Sold by
Gillespie Amy J
Bought by
Onzammy Properties Llc
Purchase Details
Closed on
Jan 7, 2009
Sold by
Dubasik Samuel P
Bought by
Gillespie Amy J
Home Financials for this Owner
Home Financials are based on the most recent Mortgage that was taken out on this home.
Original Mortgage
$136,000
Interest Rate
5.49%
Mortgage Type
Purchase Money Mortgage
Purchase Details
Closed on
Oct 5, 2006
Sold by
Marcus Samuel B
Bought by
Onzammy Properties Llc
Purchase Details
Closed on
Mar 1, 2006
Sold by
Marcus Samuel B
Bought by
Samuel B Marcus Trust and Marcus Samuel B
Purchase Details
Closed on
Sep 10, 2005
Sold by
Gray Edward W and Gray Audrey J
Bought by
Marcus Samuel B and Gillispie Amy J
Home Financials for this Owner
Home Financials are based on the most recent Mortgage that was taken out on this home.
Original Mortgage
$104,000
Interest Rate
5.5%
Mortgage Type
Purchase Money Mortgage
Purchase Details
Closed on
Feb 16, 2004
Sold by
Gray Edward W and Gray Audrey J
Bought by
Gray Edward W and Gray Audrey J
Purchase Details
Closed on
Aug 11, 1999
Sold by
Marsh Sandra M
Bought by
Gray Edward W and Gray Audrey J
Home Financials for this Owner
Home Financials are based on the most recent Mortgage that was taken out on this home.
Original Mortgage
$100,000
Interest Rate
7.56%
Mortgage Type
New Conventional
Purchase Details
Closed on
Feb 19, 1999
Sold by
Marsha John W
Bought by
Marsha Sandra M
Create a Home Valuation Report for This Property
The Home Valuation Report is an in-depth analysis detailing your home's value as well as a comparison with similar homes in the area
Home Values in the Area
Average Home Value in this Area
Purchase History
| Date | Buyer | Sale Price | Title Company |
|---|---|---|---|
| Onzammy Properties Llc | -- | None Available | |
| Gillesple Amy J | -- | Security Title Agency | |
| Gillesple Amy J | -- | Security Title Agency | |
| Onzammy Properties Llc | -- | None Available | |
| Gillespie Amy J | -- | Great American Title Agency | |
| Onzammy Properties Llc | -- | The Talon Group | |
| Samuel B Marcus Trust | -- | None Available | |
| Marcus Samuel B | $248,000 | -- | |
| Gray Edward W | -- | -- | |
| Gray Edward W | $127,900 | Capital Title Agency | |
| Marsha Sandra M | -- | -- |
Source: Public Records
Mortgage History
| Date | Status | Borrower | Loan Amount |
|---|---|---|---|
| Open | Gillesple Amy J | $132,300 | |
| Previous Owner | Gillespie Amy J | $136,000 | |
| Previous Owner | Marcus Samuel B | $104,000 | |
| Previous Owner | Gray Edward W | $100,000 |
Source: Public Records
Tax History Compared to Growth
Tax History
| Year | Tax Paid | Tax Assessment Tax Assessment Total Assessment is a certain percentage of the fair market value that is determined by local assessors to be the total taxable value of land and additions on the property. | Land | Improvement |
|---|---|---|---|---|
| 2025 | $1,611 | $16,330 | -- | -- |
| 2024 | $1,371 | $15,553 | -- | -- |
| 2023 | $1,371 | $36,000 | $7,200 | $28,800 |
| 2022 | $1,341 | $25,810 | $5,160 | $20,650 |
| 2021 | $1,378 | $23,700 | $4,740 | $18,960 |
| 2020 | $1,359 | $20,200 | $4,040 | $16,160 |
| 2019 | $1,259 | $18,920 | $3,780 | $15,140 |
| 2018 | $1,202 | $17,500 | $3,500 | $14,000 |
| 2017 | $1,164 | $16,450 | $3,290 | $13,160 |
| 2016 | $1,143 | $15,100 | $3,020 | $12,080 |
| 2015 | $1,080 | $15,000 | $3,000 | $12,000 |
Source: Public Records
Map
Nearby Homes
- 1351 W Plata Ave
- 1337 W Pampa Ave
- 3030 S Alma School Rd Unit 12
- 3030 S Alma School Rd Unit 10
- 2741 S Brooks --
- 1531 W Naranja Ave
- 1555 W Naranja Ave
- 945 W Portobello Ave
- 1639 W Nido Ave
- 898 W Sterling Place
- 962 W Keating Ave
- 2937 S Pennington
- 716 W Boxelder Place
- 2522 S Spruce
- 2722 S Pennington
- 1114 W Meseto Ave
- 2834 S Extension Rd Unit 1031
- 722 W Sterling Place
- 1335 W Straford Dr
- 1160 W Madero Cir
- 1361 W Onza Ave
- 1364 W Obispo Ave
- 1356 W Obispo Ave
- 2867 S Standage
- 1355 W Onza Ave
- 2912 S Standage
- 1350 W Obispo Ave
- 2902 S Standage
- 2922 S Standage
- 2868 S Elm Cir
- 2932 S Standage
- 1347 W Onza Ave
- 2861 S Standage
- 1344 W Obispo Ave
- 1357 W Obispo Ave
- 2862 S Elm Cir
- 2860 S Standage
- 2942 S Standage
- 1351 W Obispo Ave
- 1341 W Onza Ave