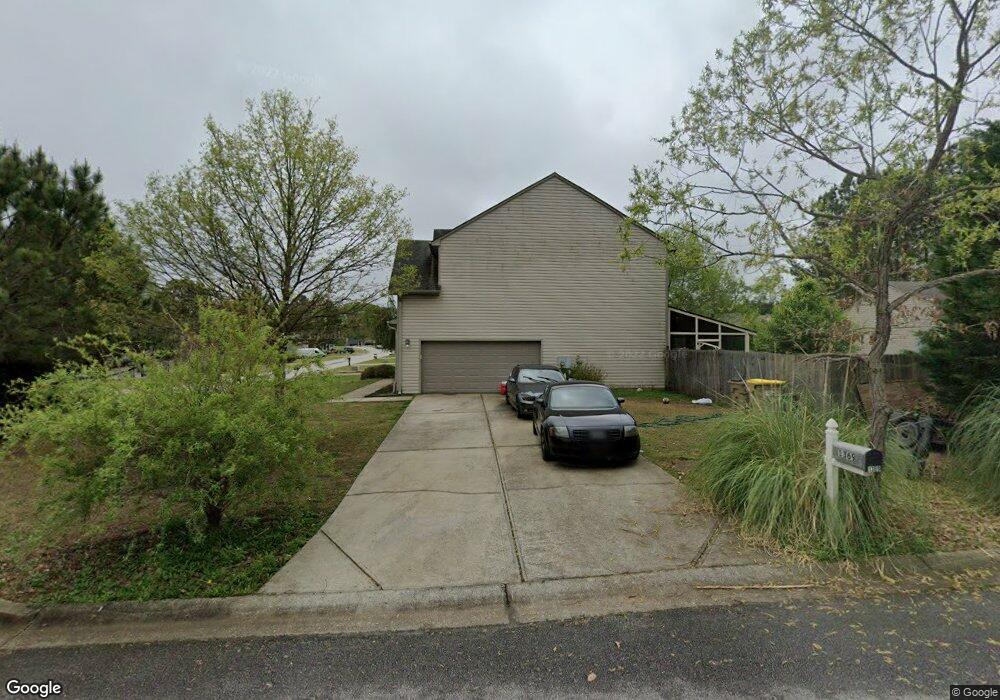
1369 Yorkshire Dr Unit lot15B Winder, GA 30680
Estimated Value: $375,000 - $429,000
5
Beds
3
Baths
3,064
Sq Ft
$129/Sq Ft
Est. Value
About This Home
This home is located at 1369 Yorkshire Dr Unit lot15B, Winder, GA 30680 and is currently estimated at $394,285, approximately $128 per square foot. 1369 Yorkshire Dr Unit lot15B is a home located in Barrow County with nearby schools including Yargo Elementary School, Haymon-Morris Middle School, and Apalachee High School.
Ownership History
Date
Name
Owned For
Owner Type
Purchase Details
Closed on
Nov 5, 2020
Sold by
Tipton Lance B
Bought by
Stevens Roxana Iveth
Current Estimated Value
Home Financials for this Owner
Home Financials are based on the most recent Mortgage that was taken out on this home.
Original Mortgage
$216,000
Outstanding Balance
$191,099
Interest Rate
2.8%
Mortgage Type
New Conventional
Estimated Equity
$203,186
Purchase Details
Closed on
Mar 26, 2008
Sold by
Clack Const Llc
Bought by
Tipton Lance B and Tipton Jessica A
Home Financials for this Owner
Home Financials are based on the most recent Mortgage that was taken out on this home.
Original Mortgage
$212,900
Interest Rate
5.97%
Mortgage Type
VA
Purchase Details
Closed on
Nov 1, 2007
Sold by
Dun-La-Hur Development Inc
Bought by
Clack Construction Llc
Purchase Details
Closed on
Aug 4, 2004
Bought by
Dun-La-Hur Development Inc
Create a Home Valuation Report for This Property
The Home Valuation Report is an in-depth analysis detailing your home's value as well as a comparison with similar homes in the area
Home Values in the Area
Average Home Value in this Area
Purchase History
| Date | Buyer | Sale Price | Title Company |
|---|---|---|---|
| Stevens Roxana Iveth | $240,000 | -- | |
| Tipton Lance B | $212,900 | -- | |
| Clack Construction Llc | $48,000 | -- | |
| Dun-La-Hur Development Inc | -- | -- |
Source: Public Records
Mortgage History
| Date | Status | Borrower | Loan Amount |
|---|---|---|---|
| Open | Stevens Roxana Iveth | $216,000 | |
| Previous Owner | Tipton Lance B | $212,900 |
Source: Public Records
Tax History Compared to Growth
Tax History
| Year | Tax Paid | Tax Assessment Tax Assessment Total Assessment is a certain percentage of the fair market value that is determined by local assessors to be the total taxable value of land and additions on the property. | Land | Improvement |
|---|---|---|---|---|
| 2024 | $3,547 | $141,763 | $24,000 | $117,763 |
| 2023 | $3,544 | $142,163 | $24,000 | $118,163 |
| 2022 | $3,160 | $108,738 | $16,000 | $92,738 |
| 2021 | $2,965 | $108,738 | $16,000 | $92,738 |
| 2020 | $2,917 | $97,684 | $16,000 | $81,684 |
| 2019 | $3,075 | $97,684 | $16,000 | $81,684 |
| 2018 | $2,776 | $88,694 | $14,400 | $74,294 |
| 2017 | $1,983 | $68,123 | $14,400 | $53,723 |
| 2016 | $2,079 | $66,255 | $14,400 | $51,855 |
| 2015 | $2,105 | $66,808 | $14,400 | $52,408 |
| 2014 | $2,036 | $62,370 | $9,408 | $52,962 |
| 2013 | -- | $58,450 | $9,408 | $49,042 |
Source: Public Records
Map
Nearby Homes
- 1411 Silvergate Way
- 2600 Yorkwood Rd
- 746 Evergreen Dr
- 903 Kendall Park Dr
- 734 Evergreen Dr
- 32 Livingston Ct
- 933 Kendall Park Dr
- 834 Kendall Park Dr Unit 1
- 38 Holland Cove
- 50 Holland Cove
- 57 Holland Cove
- 2018 Ben Johnson Rd
- ARIA Express Plan at Willowbrook
- ANSLEY Express Plan at Willowbrook
- 852 Tom Miller Rd
- 784 Morris Ln
- 1369 Yorkshire Dr
- 1367 Yorkshire Dr
- 1424 Silvergate Way Unit 17B
- 1424 Silvergate Way
- 0 Silvergate Way Unit 8665474
- 0 Silvergate Way Unit 8588258
- 0 Silvergate Way Unit 8056419
- 0 Silvergate Way Unit 8972534
- 0 Silvergate Way Unit 8859988
- 0 Silvergate Way Unit 7009623
- 0 Silvergate Way Unit 7189990
- 0 Silvergate Way Unit 7258824
- 0 Silvergate Way Unit 7360714
- 0 Silvergate Way Unit 7553537
- 1427 Silvergate Way
- 1429 Silvergate Way
- 1429 Silvergate Way Unit 41
- 1432 Silvergate Way Unit 28A
- 1432 Silvergate Way
- 1365 Yorkshire Dr