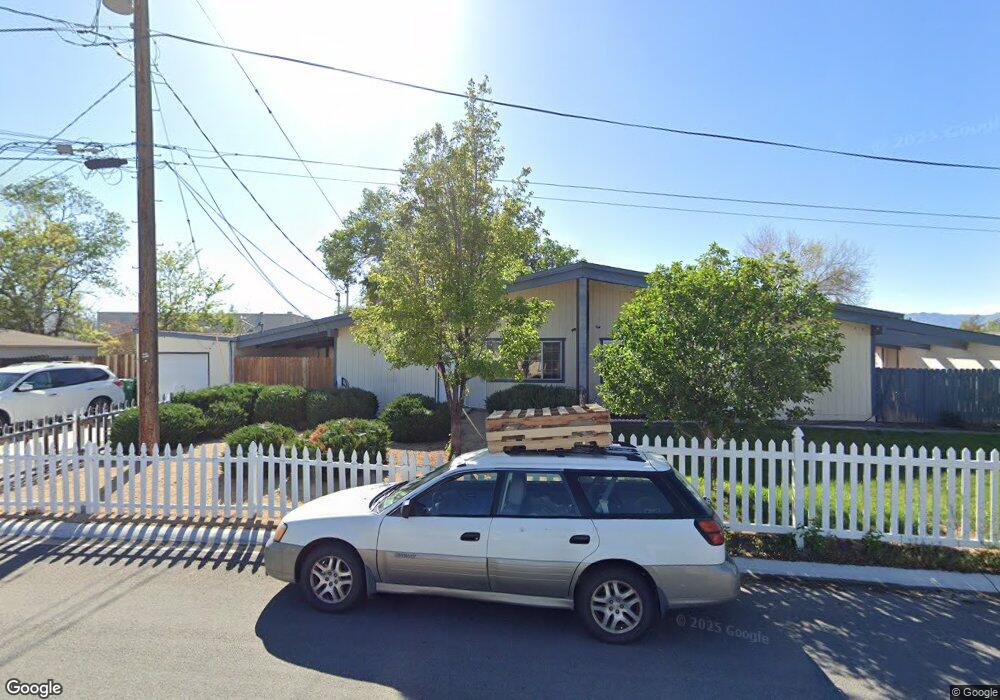
13691 Mount Baldy St Reno, NV 89506
Stead NeighborhoodEstimated Value: $270,751 - $304,000
2
Beds
1
Bath
988
Sq Ft
$295/Sq Ft
Est. Value
About This Home
This home is located at 13691 Mount Baldy St, Reno, NV 89506 and is currently estimated at $291,917, approximately $295 per square foot. 13691 Mount Baldy St is a home located in Washoe County with nearby schools including Desert Heights Elementary School, William O'Brien Middle School, and North Valleys High School.
Ownership History
Date
Name
Owned For
Owner Type
Purchase Details
Closed on
Jul 2, 2010
Sold by
Pedersen Rod
Bought by
G & D Nevadaone Llc
Current Estimated Value
Purchase Details
Closed on
Jun 1, 2010
Sold by
Bouillon Paul D
Bought by
Pedersen Rod
Purchase Details
Closed on
May 27, 2003
Sold by
Hernandez Leland F
Bought by
Bouillon Paul D
Home Financials for this Owner
Home Financials are based on the most recent Mortgage that was taken out on this home.
Original Mortgage
$89,610
Interest Rate
5.53%
Mortgage Type
Unknown
Purchase Details
Closed on
Nov 8, 2002
Sold by
Sierra View Estates Unit One Homeowners
Bought by
Hernandez Leland F
Purchase Details
Closed on
Dec 23, 1993
Sold by
Schauer Dale W and Schauer Linda L
Bought by
Sierra View Estates Unit One Homeowners
Create a Home Valuation Report for This Property
The Home Valuation Report is an in-depth analysis detailing your home's value as well as a comparison with similar homes in the area
Home Values in the Area
Average Home Value in this Area
Purchase History
| Date | Buyer | Sale Price | Title Company |
|---|---|---|---|
| G & D Nevadaone Llc | $50,000 | First American Title Reno | |
| Pedersen Rod | -- | First American Title Reno | |
| Pedersen Rod | $20,100 | Accommodation | |
| Bouillon Paul D | $87,000 | First American Title | |
| Hernandez Leland F | $51,500 | Western Title Inc | |
| Sierra View Estates Unit One Homeowners | $56,000 | Stewart Title |
Source: Public Records
Mortgage History
| Date | Status | Borrower | Loan Amount |
|---|---|---|---|
| Previous Owner | Bouillon Paul D | $89,610 |
Source: Public Records
Tax History Compared to Growth
Tax History
| Year | Tax Paid | Tax Assessment Tax Assessment Total Assessment is a certain percentage of the fair market value that is determined by local assessors to be the total taxable value of land and additions on the property. | Land | Improvement |
|---|---|---|---|---|
| 2025 | $420 | $37,532 | $26,068 | $11,464 |
| 2024 | $420 | $36,303 | $24,738 | $11,565 |
| 2023 | $302 | $33,419 | $23,375 | $10,044 |
| 2022 | $397 | $27,630 | $19,252 | $8,378 |
| 2021 | $385 | $21,332 | $13,067 | $8,265 |
| 2020 | $373 | $21,101 | $12,934 | $8,167 |
| 2019 | $362 | $20,078 | $12,303 | $7,775 |
| 2018 | $346 | $14,875 | $7,448 | $7,427 |
| 2017 | $331 | $13,990 | $6,750 | $7,240 |
| 2016 | $323 | $12,505 | $5,220 | $7,285 |
| 2015 | $322 | $10,588 | $3,392 | $7,196 |
| 2014 | $313 | $9,336 | $2,627 | $6,709 |
| 2013 | -- | $8,199 | $1,663 | $6,536 |
Source: Public Records
Map
Nearby Homes
- 13790 Mount Babcock St
- 13631 Mount Rainier St
- 13440 Fort Sage Ct
- 13630 Mount Whitney St
- 13570 Mount Rainier St
- 14405 Durham Dr
- 14388 Durham Dr
- 14345 Murdoch Dr
- 14390 Loyola Dr
- 13161 Mount Logan St
- 14412 Leiden Dr
- 14350 Loyola Dr
- 14312 Durham Dr
- 14448 Fredonia Dr
- 11043 Athabasca Dr
- 10965 Bloomsburg Dr
- 13990 Lear Blvd
- 11006 Athabasca Dr
- 11008 Zeolite Dr
- 10038 Humite Ln
- 13693 Mount Baldy St
- 13655 Mount Baldy St Unit 1
- 13800 Mount Babcock St
- 13660 Mount Baldy St
- 13810 Mount Babcock St
- 13662 Mount Shasta St
- 13770 Mount Babcock St
- 13820 Mount Babcock St
- 13645 Mount Baldy St
- 13760 Mount Babcock St
- 13830 Mount Babcock St
- 13702 Mount Shasta St
- 13632 Mount Baldy St
- 13740 Mount Babcock St
- 13763 Mount Whitney St
- 13700 Mount Shasta St
- 13730 Mount Babcock St
- 13623 Mount Baldy St
- 13685 Mount Shasta St
- 13692 Mount Shasta St