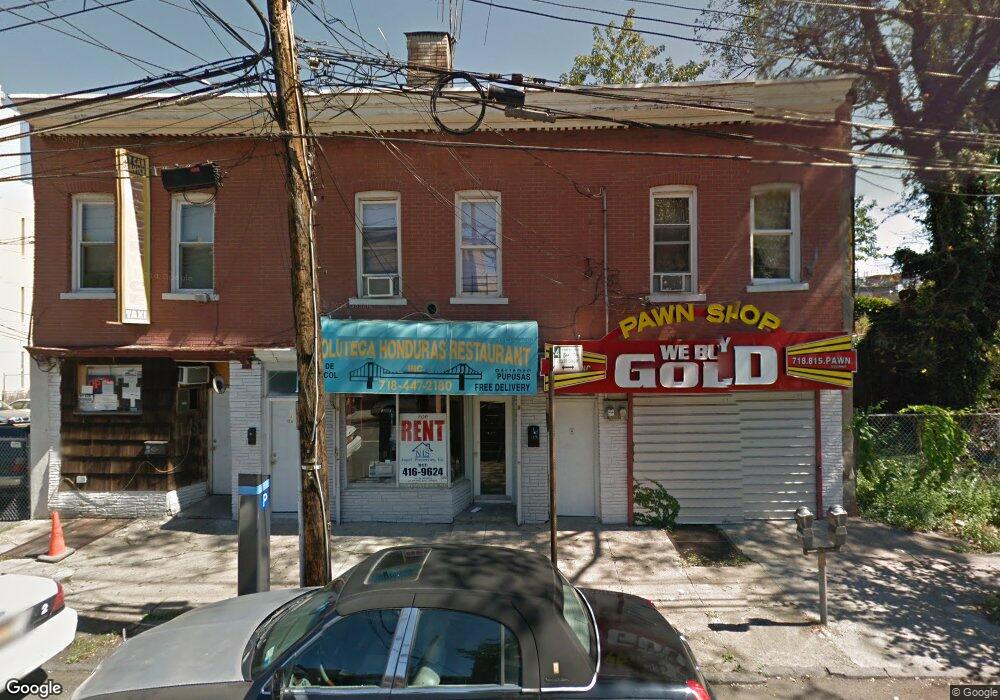
137-139 Montgomery Ave Staten Island, NY 10301
Saint George NeighborhoodEstimated Value: $1,036,070
--
Bed
--
Bath
3,100
Sq Ft
$334/Sq Ft
Est. Value
About This Home
This home is located at 137-139 Montgomery Ave, Staten Island, NY 10301 and is currently estimated at $1,036,070, approximately $334 per square foot. 137-139 Montgomery Ave is a home located in Richmond County with nearby schools including P.S. 16 John J Driscoll, Fort Hill Collaborative Elementary, and P.S. 74 Future Leaders Elementary School.
Ownership History
Date
Name
Owned For
Owner Type
Purchase Details
Closed on
Nov 16, 2023
Sold by
116-18 Linden Boulevard Llc
Bought by
116-18 Linden Boulevard Llc
Current Estimated Value
Purchase Details
Closed on
Oct 18, 2019
Sold by
Wagman Bradley S
Bought by
116 18 Linden Boulevard Llc
Home Financials for this Owner
Home Financials are based on the most recent Mortgage that was taken out on this home.
Original Mortgage
$525,000
Interest Rate
3.7%
Mortgage Type
Commercial
Purchase Details
Closed on
Aug 16, 2002
Sold by
Wagman Bradley S and Filosa Michele
Bought by
Wagman Bradley S
Home Financials for this Owner
Home Financials are based on the most recent Mortgage that was taken out on this home.
Original Mortgage
$225,000
Interest Rate
6.09%
Mortgage Type
Commercial
Create a Home Valuation Report for This Property
The Home Valuation Report is an in-depth analysis detailing your home's value as well as a comparison with similar homes in the area
Home Values in the Area
Average Home Value in this Area
Purchase History
| Date | Buyer | Sale Price | Title Company |
|---|---|---|---|
| 116-18 Linden Boulevard Llc | -- | None Listed On Document | |
| 116 18 Linden Boulevard Llc | $850,000 | Gem Abstract Corp | |
| Wagman Bradley S | -- | Commonwealth Land Title Ins |
Source: Public Records
Mortgage History
| Date | Status | Borrower | Loan Amount |
|---|---|---|---|
| Previous Owner | 116 18 Linden Boulevard Llc | $525,000 | |
| Previous Owner | Wagman Bradley S | $225,000 |
Source: Public Records
Tax History Compared to Growth
Tax History
| Year | Tax Paid | Tax Assessment Tax Assessment Total Assessment is a certain percentage of the fair market value that is determined by local assessors to be the total taxable value of land and additions on the property. | Land | Improvement |
|---|---|---|---|---|
| 2025 | $5,630 | $230,400 | $1,140 | $229,260 |
| 2024 | $5,630 | $240,750 | $1,010 | $239,740 |
| 2023 | $5,115 | $41,700 | $1,085 | $40,615 |
| 2022 | $5,102 | $172,800 | $5,400 | $167,400 |
| 2021 | $4,956 | $171,450 | $5,400 | $166,050 |
| 2020 | $4,667 | $187,650 | $5,400 | $182,250 |
| 2019 | $4,150 | $186,300 | $5,400 | $180,900 |
| 2018 | $4,080 | $32,077 | $822 | $31,255 |
| 2017 | $4,080 | $32,077 | $863 | $31,214 |
| 2016 | $4,007 | $31,080 | $921 | $30,159 |
| 2015 | $3,503 | $28,779 | $857 | $27,922 |
| 2014 | $3,503 | $26,648 | $848 | $25,800 |
Source: Public Records
Map
Nearby Homes
- 78 Victory Blvd
- 94 Victory Blvd
- 96 Victory Blvd
- 109 Monroe Ave
- 58 van Duzer St
- 97 Victory Blvd
- 214 Bay St
- 103 Monroe Ave
- 99 Monroe Ave
- 27 Tompkins Cir
- 78 van Duzer St
- 47,49 Tompkins Cir
- 47 Tompkins Cir
- 87 Montgomery Ave
- 155 Bay St Unit 2L
- 155 Bay St Unit 4F
- 155 Bay St Unit 5B
- 83 Montgomery Ave
- 77 Montgomery Ave
- 102 Montgomery Ave
- 137 Montgomery Ave
- 135 Montgomery Ave Unit 135-139
- 135 Montgomery Ave Unit 137/139
- 135 Montgomery Ave
- 139 Montgomery Ave
- 59 Victory Blvd
- 450 Saint Marks Place
- 57 Victory Blvd
- 61 Victory Blvd
- 55 Victory Blvd
- 61-63 Victory Blvd
- 444 Saint Marks Place
- 53 Victory Blvd
- 121 Montgomery Ave
- 51 Victory Blvd
- 67 Victory Blvd
- 119 Montgomery Ave Unit 2
- 119 Montgomery Ave
- 69 Victory Blvd Unit 1
- 69 Victory Blvd