Estimated Value: $386,315 - $476,000
3
Beds
1
Bath
878
Sq Ft
$496/Sq Ft
Est. Value
About This Home
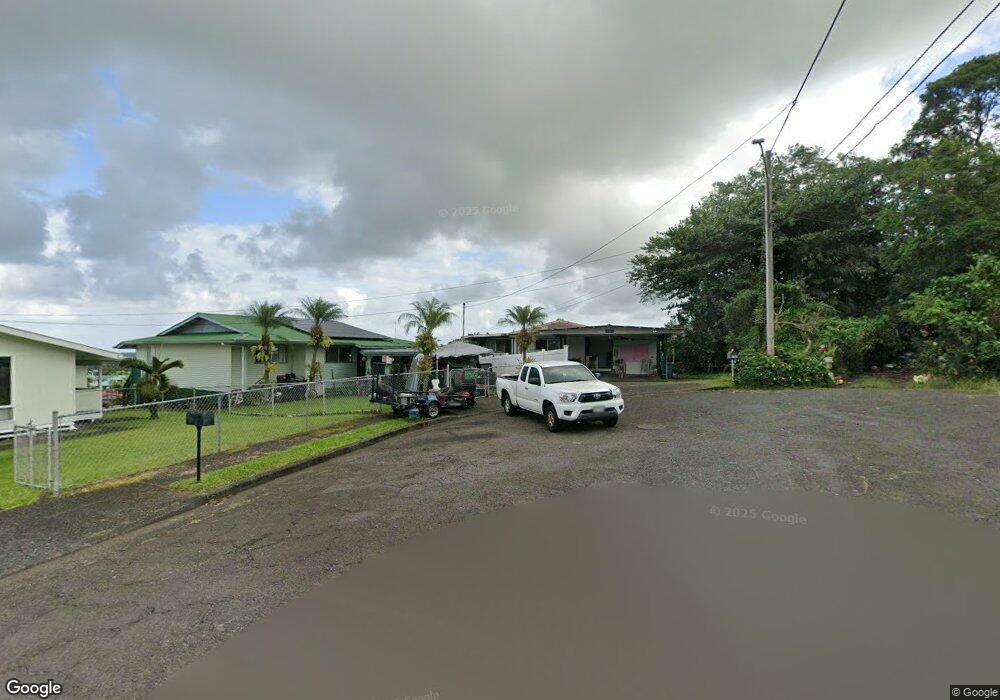
This home is located at 137 Aapi Place, Hilo, HI 96720 and is currently estimated at $435,329, approximately $495 per square foot. 137 Aapi Place is a home located in Hawaii County with nearby schools including Chiefess Kapiolani Elementary School, Hilo Intermediate School, and Hilo High School.
Ownership History
Date
Name
Owned For
Owner Type
Purchase Details
Closed on
Jul 8, 2025
Sold by
Lawson Chelsee Kalanikiekie
Bought by
Lawson Chelsee Kalanikiekie and Lawson Chad Anthony
Current Estimated Value
Purchase Details
Closed on
Sep 28, 2017
Sold by
Ching Christine Keola
Bought by
Lawson Chelsee Kalanikiekie
Purchase Details
Closed on
Mar 17, 2017
Sold by
Ching Mary Esther Kalanikiekie
Bought by
Ching Christine Keola
Create a Home Valuation Report for This Property
The Home Valuation Report is an in-depth analysis detailing your home's value as well as a comparison with similar homes in the area
Home Values in the Area
Average Home Value in this Area
Purchase History
| Date | Buyer | Sale Price | Title Company |
|---|---|---|---|
| Lawson Chelsee Kalanikiekie | -- | None Listed On Document | |
| Lawson Chelsee Kalanikiekie | -- | None Listed On Document | |
| Lawson Chelsee Kalanikiekie | -- | None Available | |
| Ching Christine Keola | -- | None Available |
Source: Public Records
Tax History Compared to Growth
Tax History
| Year | Tax Paid | Tax Assessment Tax Assessment Total Assessment is a certain percentage of the fair market value that is determined by local assessors to be the total taxable value of land and additions on the property. | Land | Improvement |
|---|---|---|---|---|
| 2025 | $804 | $238,300 | $92,500 | $145,800 |
| 2024 | $803 | $231,400 | $92,500 | $138,900 |
| 2023 | $798 | $224,700 | $92,500 | $132,200 |
| 2022 | $814 | $218,200 | $92,500 | $125,700 |
| 2021 | $796 | $211,800 | $92,500 | $119,300 |
| 2020 | $766 | $205,600 | $92,500 | $113,100 |
| 2019 | $736 | $199,600 | $92,500 | $107,100 |
| 2018 | $2,021 | $182,100 | $92,500 | $89,600 |
| 2017 | $1,950 | $175,700 | $88,000 | $87,700 |
| 2016 | $1,583 | $157,500 | $83,500 | $74,000 |
| 2015 | $1,340 | $149,600 | $79,800 | $69,800 |
| 2014 | $1,340 | $148,400 | $79,800 | $68,600 |
Source: Public Records
Map
Nearby Homes