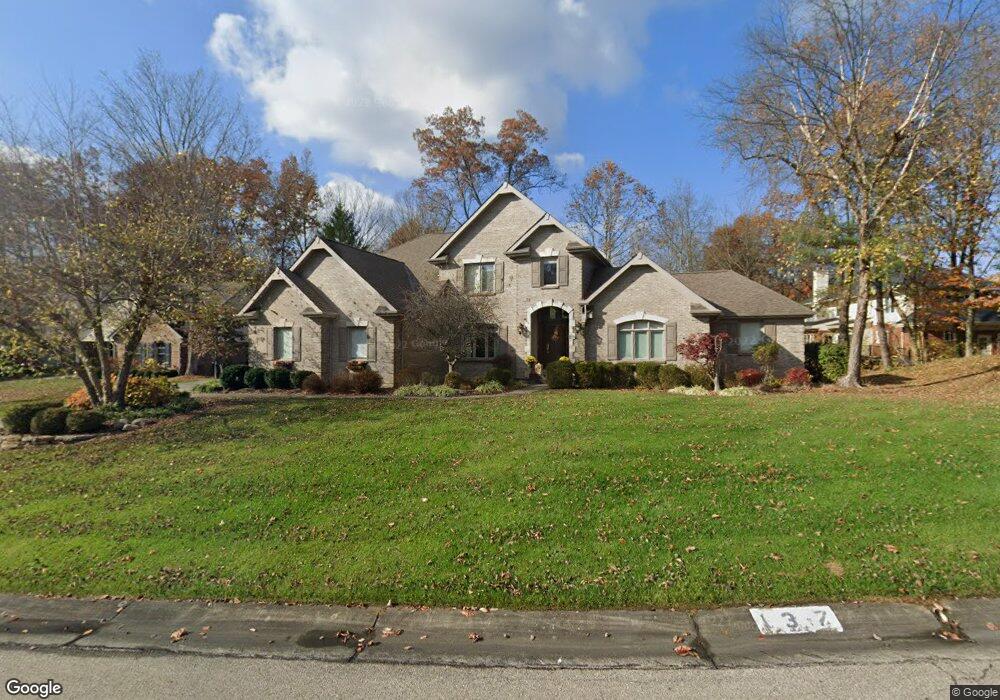
137 Apgar Dr Loveland, OH 45140
Estimated Value: $715,000 - $830,000
5
Beds
5
Baths
4,487
Sq Ft
$174/Sq Ft
Est. Value
About This Home
This home is located at 137 Apgar Dr, Loveland, OH 45140 and is currently estimated at $781,913, approximately $174 per square foot. 137 Apgar Dr is a home located in Hamilton County with nearby schools including Loveland Intermediate School, Loveland Primary School, and Loveland Elementary School.
Ownership History
Date
Name
Owned For
Owner Type
Purchase Details
Closed on
Jan 12, 2024
Sold by
Flannery Samuel John and Flannery Ellen Marie
Bought by
Flannery Family Trust and Flannery
Current Estimated Value
Purchase Details
Closed on
Feb 9, 2006
Sold by
Williams William M and Williams Courtney M
Bought by
Flannery Samuel John and Flannery Ellen Marie
Home Financials for this Owner
Home Financials are based on the most recent Mortgage that was taken out on this home.
Original Mortgage
$178,000
Interest Rate
6.48%
Mortgage Type
Fannie Mae Freddie Mac
Purchase Details
Closed on
Aug 16, 2001
Sold by
Kenneth Hiller L and Kenneth Barbara A
Bought by
Williams William M and Williams Courtney M
Purchase Details
Closed on
Dec 18, 2000
Sold by
Monnie Terrance R
Bought by
Hiller L Kenneth and Bentson Barbara A
Purchase Details
Closed on
Nov 30, 2000
Sold by
Hiller L Kenneth and Bentson Barbara A
Bought by
Monnie Terrance R
Create a Home Valuation Report for This Property
The Home Valuation Report is an in-depth analysis detailing your home's value as well as a comparison with similar homes in the area
Home Values in the Area
Average Home Value in this Area
Purchase History
| Date | Buyer | Sale Price | Title Company |
|---|---|---|---|
| Flannery Family Trust | $250 | None Listed On Document | |
| Flannery Samuel John | -- | Chicago Title Insurance Co | |
| Williams William M | -- | -- | |
| Hiller L Kenneth | -- | -- | |
| Dorsch Dennis M | -- | -- | |
| Monnie Terrance R | $420,000 | -- |
Source: Public Records
Mortgage History
| Date | Status | Borrower | Loan Amount |
|---|---|---|---|
| Previous Owner | Flannery Samuel John | $178,000 |
Source: Public Records
Tax History Compared to Growth
Tax History
| Year | Tax Paid | Tax Assessment Tax Assessment Total Assessment is a certain percentage of the fair market value that is determined by local assessors to be the total taxable value of land and additions on the property. | Land | Improvement |
|---|---|---|---|---|
| 2024 | $12,221 | $231,795 | $27,195 | $204,600 |
| 2023 | $12,568 | $231,795 | $27,195 | $204,600 |
| 2022 | $11,318 | $175,064 | $26,933 | $148,131 |
| 2021 | $10,739 | $175,064 | $26,933 | $148,131 |
| 2020 | $10,908 | $175,064 | $26,933 | $148,131 |
| 2019 | $10,705 | $160,608 | $24,710 | $135,898 |
| 2018 | $10,769 | $160,608 | $24,710 | $135,898 |
| 2017 | $10,211 | $160,608 | $24,710 | $135,898 |
| 2016 | $9,868 | $148,645 | $23,660 | $124,985 |
| 2015 | $9,976 | $148,645 | $23,660 | $124,985 |
| 2014 | $10,214 | $148,645 | $23,660 | $124,985 |
| 2013 | $9,012 | $142,930 | $22,750 | $120,180 |
Source: Public Records
Map
Nearby Homes
- 131 Lakeview Ct
- 142 Lakeview Ct
- 124 Pheasantlake Dr
- 796 Oak Canyon Dr
- 882 Quailwoods Dr
- 1864 W Loveland Ave
- 185 Dogwood Dr
- 167 Dogwood Dr
- 11164 Loveland Trace Ct
- 160 Lexington Dr
- 1072 Hickory Ridge Dr
- 247 Sinclair Ct
- 9317 E Kemper Rd
- 196 Shoemaker Dr
- 9330 Greenhedge Ln
- 10720 Weather Stone Ct
- 10734 Weatherstone
- 1886 Lindenhall Dr
- 5037 Bristol Ct Unit 213
- 5022 Bristol Ct Unit 207
- 131 Apgar Dr
- 143 Apgar Dr
- 107 Meadview Place
- 101 Southbend Ct
- 100 Southbend Ct
- 149 Apgar Dr
- 154 Apgar Dr
- 106 Meadview Place
- 119 Apgar Dr
- 148 Apgar Dr
- 106 Southbend Ct
- 142 Apgar Dr
- 107 Southbend Ct
- 113 Apgar Dr
- 172 Pheasantlake Dr
- 112 Southbend Ct
- 776 Quailwoods Dr
- 800 Quailwoods Dr
- 770 Quailwoods Dr
- 806 Quailwoods Dr