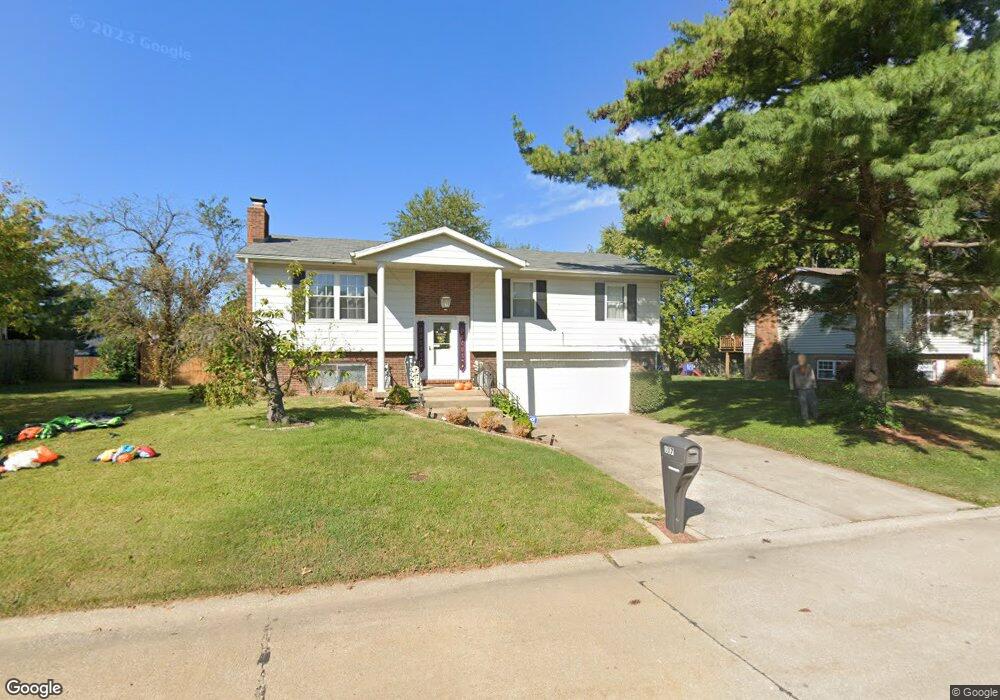
137 Big Bend Blvd Belleville, IL 62226
Estimated Value: $194,000 - $232,335
3
Beds
3
Baths
1,184
Sq Ft
$185/Sq Ft
Est. Value
About This Home
This home is located at 137 Big Bend Blvd, Belleville, IL 62226 and is currently estimated at $219,584, approximately $185 per square foot. 137 Big Bend Blvd is a home located in St. Clair County with nearby schools including Wolf Branch Elementary School, Wolf Branch Middle School, and Elite Scholars STEAM Academy.
Ownership History
Date
Name
Owned For
Owner Type
Purchase Details
Closed on
May 9, 2014
Sold by
Wells Fargo Financial Missouri Inc
Bought by
Drury Paul Michael and Drury Elizabeth Danielle
Current Estimated Value
Home Financials for this Owner
Home Financials are based on the most recent Mortgage that was taken out on this home.
Original Mortgage
$99,170
Interest Rate
4.2%
Mortgage Type
FHA
Purchase Details
Closed on
Jun 25, 2013
Sold by
England Leatriana D
Bought by
Wells Fargo Financial Missouri Inc
Purchase Details
Closed on
Jun 15, 2001
Sold by
Schaeffer Peggy Anne
Bought by
England Leatriana
Home Financials for this Owner
Home Financials are based on the most recent Mortgage that was taken out on this home.
Original Mortgage
$104,178
Interest Rate
7.11%
Mortgage Type
Purchase Money Mortgage
Create a Home Valuation Report for This Property
The Home Valuation Report is an in-depth analysis detailing your home's value as well as a comparison with similar homes in the area
Home Values in the Area
Average Home Value in this Area
Purchase History
| Date | Buyer | Sale Price | Title Company |
|---|---|---|---|
| Drury Paul Michael | $101,000 | Chicago Title Insurance Co | |
| Wells Fargo Financial Missouri Inc | -- | None Available | |
| England Leatriana | $107,500 | Town & Country Title |
Source: Public Records
Mortgage History
| Date | Status | Borrower | Loan Amount |
|---|---|---|---|
| Previous Owner | Drury Paul Michael | $99,170 | |
| Previous Owner | England Leatriana | $104,178 |
Source: Public Records
Tax History Compared to Growth
Tax History
| Year | Tax Paid | Tax Assessment Tax Assessment Total Assessment is a certain percentage of the fair market value that is determined by local assessors to be the total taxable value of land and additions on the property. | Land | Improvement |
|---|---|---|---|---|
| 2024 | $4,707 | $58,563 | $8,972 | $49,591 |
| 2023 | $4,473 | $55,118 | $8,848 | $46,270 |
| 2022 | $4,193 | $50,198 | $8,058 | $42,140 |
| 2021 | $4,100 | $48,137 | $7,727 | $40,410 |
| 2020 | $3,992 | $44,829 | $7,196 | $37,633 |
| 2019 | $3,893 | $44,864 | $7,343 | $37,521 |
| 2018 | $3,797 | $43,719 | $7,156 | $36,563 |
| 2017 | $3,701 | $42,556 | $6,966 | $35,590 |
| 2016 | $3,675 | $41,089 | $6,726 | $34,363 |
| 2014 | $3,298 | $41,562 | $6,486 | $35,076 |
| 2013 | $3,851 | $41,562 | $6,486 | $35,076 |
Source: Public Records
Map
Nearby Homes
- 109 Bourdelais Dr
- 3920 Michael John Dr
- 505 Thistle Ln
- 4906 Lawrence Dr
- 3944 Appaloosa Dr
- 525 Big Bend Blvd
- 3857 Appaloosa Dr
- 113 Lakeland Hills Dr
- 1709 Old Park Ln
- 1705 Old Park Ln
- 1737 Old Park Ln
- 1745 Old Park Ln
- 3928 Red Bird Ln
- 1749 Old Park Ln
- 3924 Red Bird Ln
- 112 Lake Stratford Ct
- 1753 Old Park Ln
- 3920 Red Bird Ln
- 1757 Old Park Ln
- 3916 Red Bird Ln
- 141 Big Bend Blvd
- 133 Big Bend Blvd
- 120 Bourdelais Dr
- 116 Bourdelais Dr
- 145 Big Bend Blvd
- 128 Bourdelais Dr
- 136 Big Bend Blvd
- 140 Big Bend Blvd
- 132 Big Bend Blvd
- 129 Big Bend Blvd
- 149 Big Bend Blvd
- 144 Big Bend Blvd
- 124 Bourdelais Dr
- 108 Bourdelais Dr
- 121 Bourdelais Dr
- 117 Bourdelais Dr
- 148 Big Bend Blvd
- 129 Urban Way Dr
- 125 Big Bend Blvd
- 125 Urban Way Dr