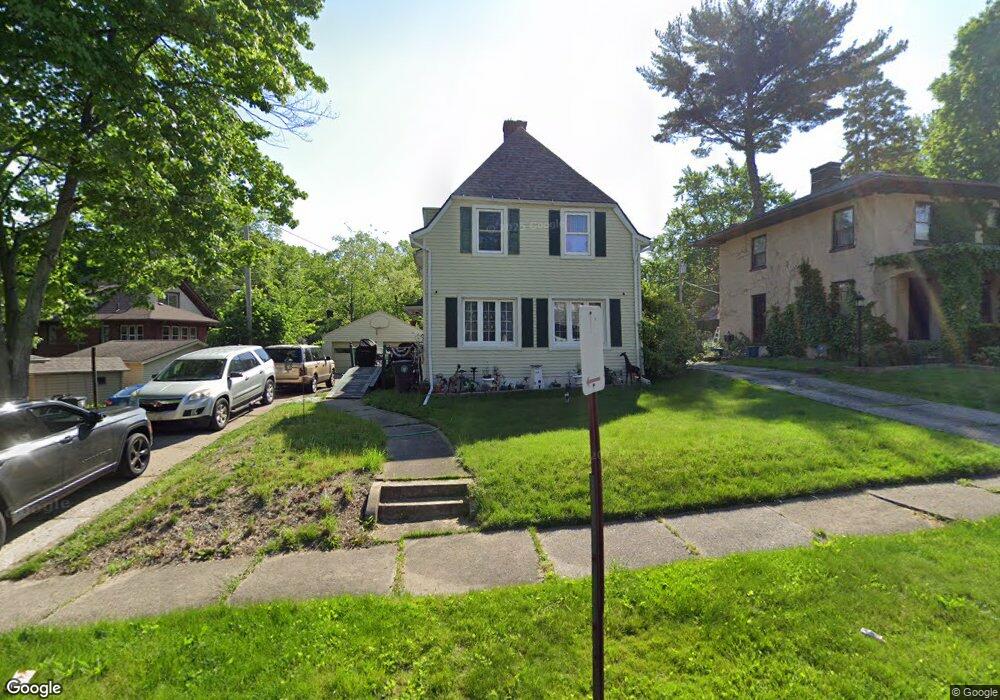
137 Crescent Dr Akron, OH 44301
Firestone Park NeighborhoodEstimated Value: $138,147 - $159,000
3
Beds
2
Baths
1,544
Sq Ft
$97/Sq Ft
Est. Value
About This Home
This home is located at 137 Crescent Dr, Akron, OH 44301 and is currently estimated at $149,037, approximately $96 per square foot. 137 Crescent Dr is a home located in Summit County with nearby schools including McEbright Elementary School, Kenmore Garfield Community Learning Center, and Main Preparatory Academy.
Ownership History
Date
Name
Owned For
Owner Type
Purchase Details
Closed on
Nov 23, 2021
Sold by
Clay Elizabeth A A
Bought by
137 Crescent Drive Llc
Current Estimated Value
Home Financials for this Owner
Home Financials are based on the most recent Mortgage that was taken out on this home.
Original Mortgage
$161,785
Outstanding Balance
$148,473
Interest Rate
3.1%
Estimated Equity
$564
Purchase Details
Closed on
Dec 22, 2004
Sold by
Prudential Residential Services Lp
Bought by
Clay Elizabeth A A
Home Financials for this Owner
Home Financials are based on the most recent Mortgage that was taken out on this home.
Original Mortgage
$96,000
Interest Rate
5.5%
Mortgage Type
Purchase Money Mortgage
Purchase Details
Closed on
Jul 19, 2000
Sold by
Trustees Mcenaney Maura A & Krause Kenneth J
Bought by
Pollard Elizabeth J
Home Financials for this Owner
Home Financials are based on the most recent Mortgage that was taken out on this home.
Original Mortgage
$99,750
Interest Rate
8.12%
Create a Home Valuation Report for This Property
The Home Valuation Report is an in-depth analysis detailing your home's value as well as a comparison with similar homes in the area
Home Values in the Area
Average Home Value in this Area
Purchase History
| Date | Buyer | Sale Price | Title Company |
|---|---|---|---|
| 137 Crescent Drive Llc | $109,000 | Kingdom | |
| Clay Elizabeth A A | $120,000 | Chicago Title Insurance Co | |
| Prudential Residential Services Lp | -- | Chicago Title Insurance Co | |
| Pollard Elizabeth J | $105,000 | Endress/Lawyers Title |
Source: Public Records
Mortgage History
| Date | Status | Borrower | Loan Amount |
|---|---|---|---|
| Open | 137 Crescent Drive Llc | $161,785 | |
| Previous Owner | Clay Elizabeth A A | $96,000 | |
| Previous Owner | Pollard Elizabeth J | $99,750 |
Source: Public Records
Tax History
| Year | Tax Paid | Tax Assessment Tax Assessment Total Assessment is a certain percentage of the fair market value that is determined by local assessors to be the total taxable value of land and additions on the property. | Land | Improvement |
|---|---|---|---|---|
| 2024 | $2,390 | $39,113 | $10,686 | $28,427 |
| 2023 | $2,390 | $39,113 | $10,686 | $28,427 |
| 2022 | $2,349 | $30,132 | $8,096 | $22,036 |
| 2021 | $2,251 | $30,132 | $8,096 | $22,036 |
| 2020 | $2,220 | $30,140 | $8,100 | $22,040 |
| 2019 | $2,125 | $27,250 | $7,530 | $19,720 |
| 2018 | $2,098 | $27,250 | $7,530 | $19,720 |
| 2017 | $2,131 | $27,250 | $7,530 | $19,720 |
| 2016 | $2,132 | $27,250 | $7,530 | $19,720 |
| 2015 | $2,131 | $27,250 | $7,530 | $19,720 |
| 2014 | $2,114 | $27,250 | $7,530 | $19,720 |
| 2013 | $2,229 | $29,460 | $7,530 | $21,930 |
Source: Public Records
Map
Nearby Homes
- 154 Crescent Dr
- 1429 Bellows St
- 167 E Ido Ave
- 62 E Ido Ave
- 75 E Ido Ave
- 178 Mission Dr
- 29 E Dartmore Ave
- 41 E Rosewood Ave
- 14 E Dartmore Ave
- 36 W Wilbeth Rd
- 147 Brighton Dr
- 26 Brighton Dr
- 22 Brighton Dr
- 30 Youtz Ave
- 22 Youtz Ave
- 75 W Dartmore Ave
- 1597 Glenmount Ave
- 368 E Ido Ave
- 1383 Curtis St
- 244 E Catawba Ave
- 143 Crescent Dr
- 142 E Firestone Blvd
- 134 E Firestone Blvd
- 147 Crescent Dr
- 150 E Firestone Blvd
- 153 Crescent Dr
- 136 Crescent Dr
- 140 Crescent Dr
- 126 Crescent Dr
- 157 Crescent Dr
- 144 Crescent Dr
- 122 Crescent Dr
- 161 Crescent Dr
- 150 Crescent Dr
- 164 S Firestone Blvd
- 1488 Thornapple Ave
- 158 Crescent Dr
- 167 Crescent Dr
- 1479 Thornapple Ave
- 162 Crescent Dr
Your Personal Tour Guide
Ask me questions while you tour the home.