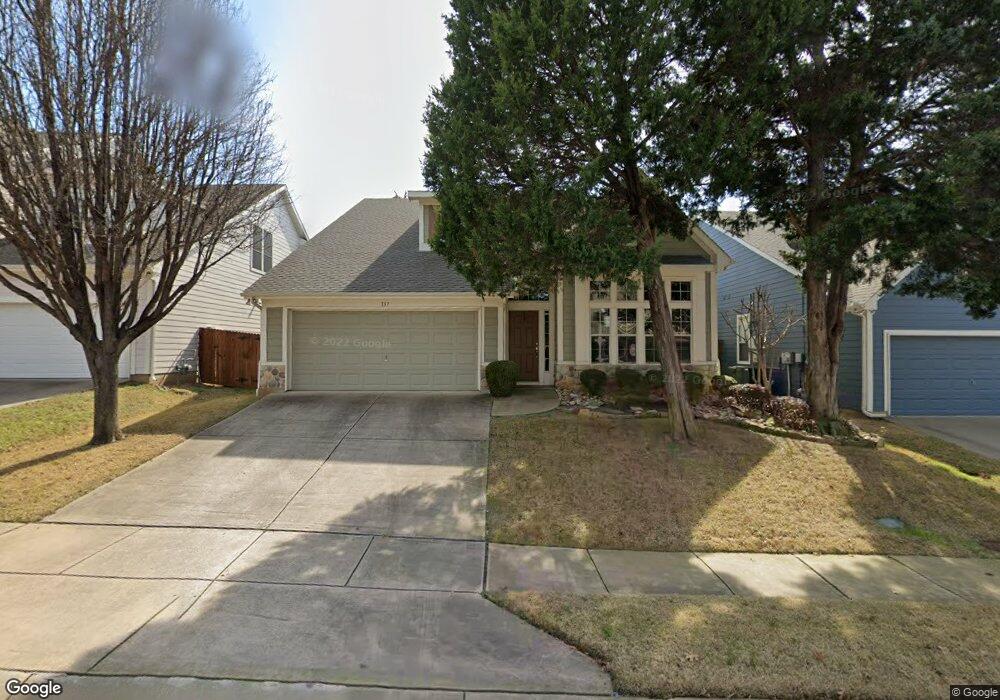
137 Fall Creek Grapevine, TX 76051
Estimated Value: $549,000 - $617,000
3
Beds
2
Baths
2,137
Sq Ft
$274/Sq Ft
Est. Value
About This Home
This home is located at 137 Fall Creek, Grapevine, TX 76051 and is currently estimated at $585,685, approximately $274 per square foot. 137 Fall Creek is a home located in Tarrant County with nearby schools including Silver Lake Elementary School, Grapevine Middle, and Vine Academy.
Ownership History
Date
Name
Owned For
Owner Type
Purchase Details
Closed on
Sep 30, 2020
Sold by
Janice B Smart Trust and David L And Janice B Smart Trust
Bought by
Sloan Susan
Current Estimated Value
Home Financials for this Owner
Home Financials are based on the most recent Mortgage that was taken out on this home.
Original Mortgage
$255,500
Outstanding Balance
$227,254
Interest Rate
2.9%
Mortgage Type
New Conventional
Estimated Equity
$358,431
Purchase Details
Closed on
May 13, 2009
Sold by
Anderson Lance G and Anderson Kristine C
Bought by
Smart Janice B and The Janice B Smart Trust
Purchase Details
Closed on
Sep 8, 2005
Sold by
Weekley Homes Lp
Bought by
Anderson Lance G and Anderson Kristine C
Home Financials for this Owner
Home Financials are based on the most recent Mortgage that was taken out on this home.
Original Mortgage
$196,000
Interest Rate
5.8%
Mortgage Type
Fannie Mae Freddie Mac
Create a Home Valuation Report for This Property
The Home Valuation Report is an in-depth analysis detailing your home's value as well as a comparison with similar homes in the area
Home Values in the Area
Average Home Value in this Area
Purchase History
| Date | Buyer | Sale Price | Title Company |
|---|---|---|---|
| Sloan Susan | -- | Lawyers Title | |
| Smart Janice B | -- | Hexter Fair Title Company | |
| Anderson Lance G | -- | Priority Title |
Source: Public Records
Mortgage History
| Date | Status | Borrower | Loan Amount |
|---|---|---|---|
| Open | Sloan Susan | $255,500 | |
| Previous Owner | Anderson Lance G | $196,000 |
Source: Public Records
Tax History
| Year | Tax Paid | Tax Assessment Tax Assessment Total Assessment is a certain percentage of the fair market value that is determined by local assessors to be the total taxable value of land and additions on the property. | Land | Improvement |
|---|---|---|---|---|
| 2025 | $1,839 | $560,266 | $125,000 | $435,266 |
| 2024 | $1,839 | $560,266 | $125,000 | $435,266 |
| 2023 | $8,086 | $542,069 | $115,000 | $427,069 |
| 2022 | $8,687 | $472,260 | $80,000 | $392,260 |
| 2021 | $8,667 | $398,623 | $80,000 | $318,623 |
| 2020 | $8,179 | $371,863 | $80,000 | $291,863 |
| 2019 | $8,511 | $373,223 | $80,000 | $293,223 |
| 2018 | $1,247 | $352,231 | $80,000 | $272,231 |
| 2017 | $7,709 | $333,353 | $80,000 | $253,353 |
| 2016 | $7,583 | $334,151 | $80,000 | $254,151 |
| 2015 | $3,080 | $304,636 | $60,000 | $244,636 |
| 2014 | $3,080 | $271,000 | $40,000 | $231,000 |
Source: Public Records
Map
Nearby Homes
- 953 Spring Creek Dr
- 1024 S Riverside Dr
- 218 W Peach St
- 202 Ivy Glen Dr
- 1810 Teton Dr
- 941 Meadowbend Loop S
- 309 N Main St
- 1723 Anglers Plaza
- 471 Caviness Dr
- 2040 Casa Loma Ct
- 1013 Mockingbird Dr
- 2100 Dove Loop Rd Unit 30RD
- 1546 Dublin Cir
- 1213 Hillwood Way
- 1626 Choteau Cir
- 1505 Briarcrest Dr
- 1641 Choteau Cir
- 6007 Laurel Ln
- 6011 Laurel Ln
- 1804 Hunters Ridge Dr
- 141 Fall Creek
- 133 Fall Creek
- 145 Fall Creek
- 129 Fall Creek
- 112 Nestlewood Ln
- 108 Nestlewood Ln
- 116 Nestlewood Ln
- 120 Nestlewood Ln
- 104 Nestlewood Ln
- 134 Fall Creek
- 977 Fall Creek
- 138 Fall Creek
- 130 Fall Creek
- 142 Fall Creek
- 126 Fall Creek
- 1053 Honeysuckle
- 100 Nestlewood Ln
- 146 Fall Creek
- 1045 Honeysuckle
- 122 Fall Creek
Your Personal Tour Guide
Ask me questions while you tour the home.