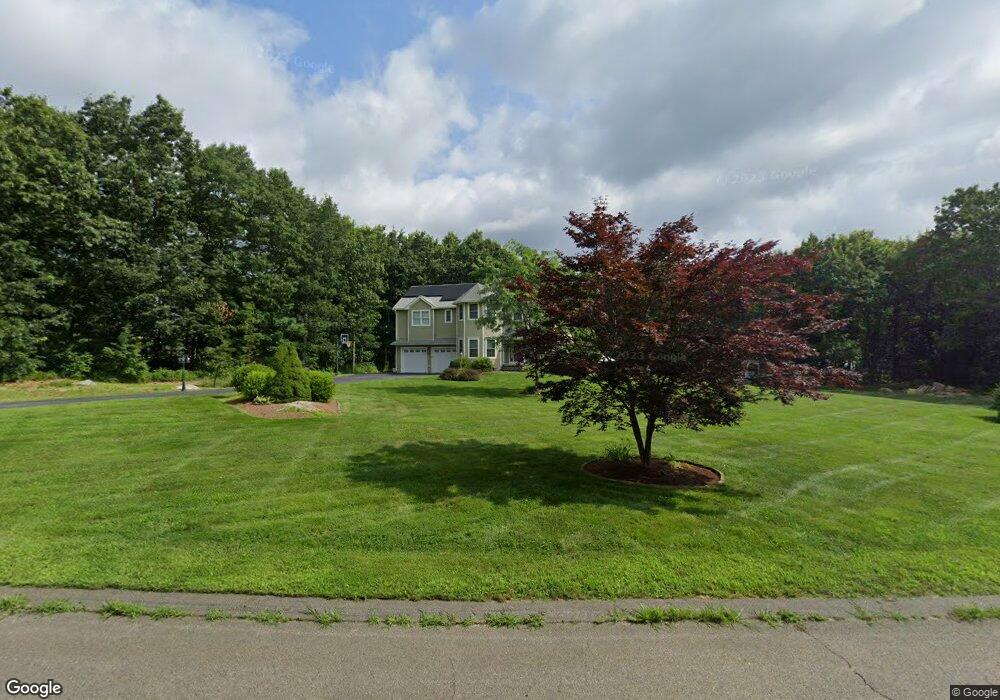
137 Kasey Ct Uxbridge, MA 01569
Estimated Value: $855,397 - $1,151,000
5
Beds
3
Baths
3,660
Sq Ft
$258/Sq Ft
Est. Value
About This Home
This home is located at 137 Kasey Ct, Uxbridge, MA 01569 and is currently estimated at $945,849, approximately $258 per square foot. 137 Kasey Ct is a home located in Worcester County with nearby schools including Uxbridge High School.
Ownership History
Date
Name
Owned For
Owner Type
Purchase Details
Closed on
Aug 8, 2003
Sold by
Fred Hutnak Dev Corp I
Bought by
Chludenski Chester Albert and Chludenski Christi Lee
Current Estimated Value
Home Financials for this Owner
Home Financials are based on the most recent Mortgage that was taken out on this home.
Original Mortgage
$129,375
Outstanding Balance
$54,612
Interest Rate
5.28%
Mortgage Type
Purchase Money Mortgage
Estimated Equity
$891,237
Create a Home Valuation Report for This Property
The Home Valuation Report is an in-depth analysis detailing your home's value as well as a comparison with similar homes in the area
Home Values in the Area
Average Home Value in this Area
Purchase History
| Date | Buyer | Sale Price | Title Company |
|---|---|---|---|
| Chludenski Chester Albert | $172,500 | -- |
Source: Public Records
Mortgage History
| Date | Status | Borrower | Loan Amount |
|---|---|---|---|
| Open | Chludenski Chester Albert | $129,375 |
Source: Public Records
Tax History Compared to Growth
Tax History
| Year | Tax Paid | Tax Assessment Tax Assessment Total Assessment is a certain percentage of the fair market value that is determined by local assessors to be the total taxable value of land and additions on the property. | Land | Improvement |
|---|---|---|---|---|
| 2025 | $10,362 | $790,400 | $170,700 | $619,700 |
| 2024 | $9,822 | $760,200 | $161,900 | $598,300 |
| 2023 | $9,430 | $676,000 | $140,100 | $535,900 |
| 2022 | $8,559 | $564,600 | $122,600 | $442,000 |
| 2021 | $8,932 | $564,600 | $122,600 | $442,000 |
| 2020 | $9,463 | $565,300 | $131,300 | $434,000 |
| 2019 | $9,543 | $550,000 | $144,400 | $405,600 |
| 2018 | $7,325 | $426,600 | $144,400 | $282,200 |
| 2017 | $6,684 | $394,100 | $129,800 | $264,300 |
| 2016 | $6,822 | $388,300 | $113,400 | $274,900 |
| 2015 | $6,657 | $382,600 | $113,400 | $269,200 |
Source: Public Records
Map
Nearby Homes
- 29 Glendale St
- 36 Clark Rd
- 239 Aldrich St
- 215 Chestnut St
- 15 Turner Farm Rd
- 12 Turner Farm Rd
- 18 Turner Farm Rd
- 139 Turner Farm Rd
- 46 Turner Farm Rd
- 45 Turner Farm Rd
- 127 Turner Farm Rd
- 117 Turner Farm Rd
- 70 Chocolog Rd
- 13 Perry St
- 9 Balm of Life Spring Rd
- 307 S East Main St Unit Lot 9
- 303 S East Main St Unit Lot 8
- 299 S East Main St Unit Lot 7
- 104 Eber Taft Rd
- 295 S East Main St Unit Lot 6