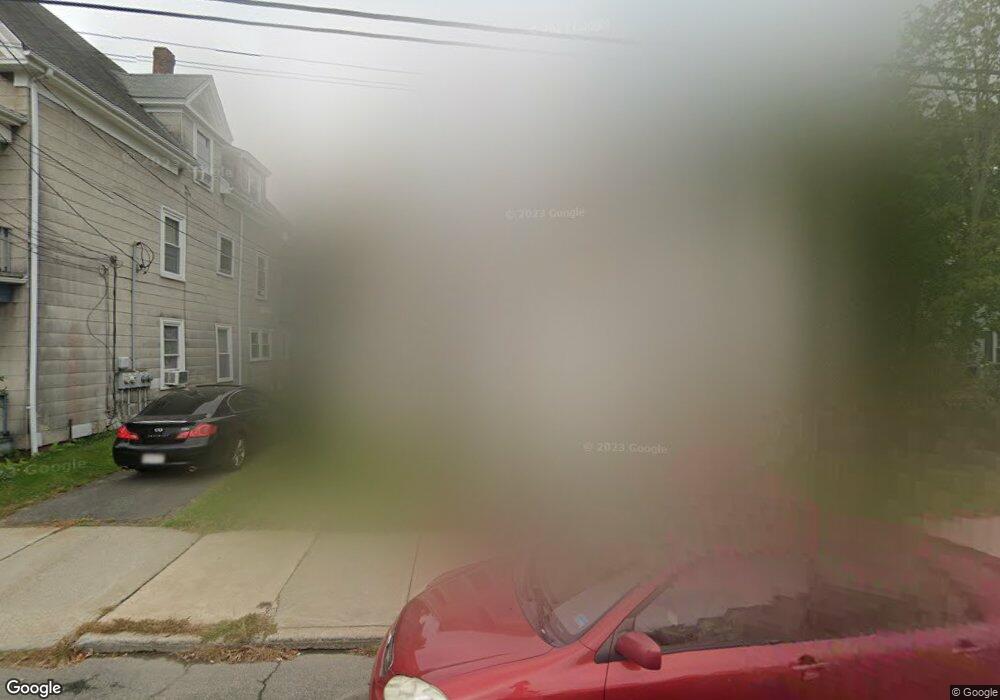
137 Maple St Lynn, MA 01904
Lynn English NeighborhoodEstimated Value: $564,000 - $588,000
2
Beds
1
Bath
1,523
Sq Ft
$377/Sq Ft
Est. Value
About This Home
This home is located at 137 Maple St, Lynn, MA 01904 and is currently estimated at $574,425, approximately $377 per square foot. 137 Maple St is a home located in Essex County with nearby schools including Edward A. Sisson Elementary School, William R. Fallon School, and Pickering Middle School.
Ownership History
Date
Name
Owned For
Owner Type
Purchase Details
Closed on
Sep 9, 2010
Sold by
Dunleavy Kevin F
Bought by
Lopez Miguel A
Current Estimated Value
Home Financials for this Owner
Home Financials are based on the most recent Mortgage that was taken out on this home.
Original Mortgage
$207,668
Outstanding Balance
$137,547
Interest Rate
4.5%
Mortgage Type
FHA
Estimated Equity
$436,878
Create a Home Valuation Report for This Property
The Home Valuation Report is an in-depth analysis detailing your home's value as well as a comparison with similar homes in the area
Home Values in the Area
Average Home Value in this Area
Purchase History
| Date | Buyer | Sale Price | Title Company |
|---|---|---|---|
| Lopez Miguel A | $211,500 | -- |
Source: Public Records
Mortgage History
| Date | Status | Borrower | Loan Amount |
|---|---|---|---|
| Open | Lopez Miguel A | $207,668 | |
| Previous Owner | Lopez Miguel A | $175,000 | |
| Previous Owner | Lopez Miguel A | $40,000 |
Source: Public Records
Tax History
| Year | Tax Paid | Tax Assessment Tax Assessment Total Assessment is a certain percentage of the fair market value that is determined by local assessors to be the total taxable value of land and additions on the property. | Land | Improvement |
|---|---|---|---|---|
| 2025 | $5,437 | $524,800 | $206,800 | $318,000 |
| 2024 | $5,289 | $502,300 | $202,100 | $300,200 |
| 2023 | $5,045 | $452,500 | $190,000 | $262,500 |
| 2022 | $4,766 | $383,400 | $149,400 | $234,000 |
| 2021 | $4,813 | $369,400 | $151,200 | $218,200 |
| 2020 | $4,517 | $337,100 | $136,300 | $200,800 |
| 2019 | $4,537 | $317,300 | $128,400 | $188,900 |
| 2018 | $4,198 | $277,100 | $119,500 | $157,600 |
| 2017 | $3,945 | $252,900 | $105,500 | $147,400 |
| 2016 | $3,830 | $236,700 | $97,600 | $139,100 |
| 2015 | $3,765 | $224,800 | $103,600 | $121,200 |
Source: Public Records
Map
Nearby Homes
Your Personal Tour Guide
Ask me questions while you tour the home.