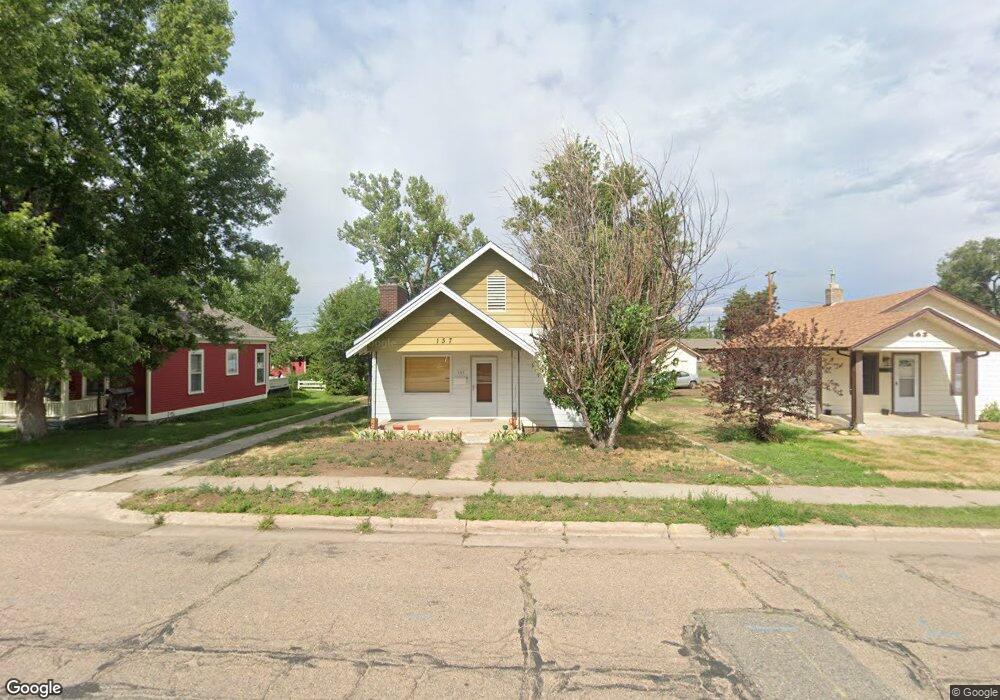
137 Mckinley Ave Fort Lupton, CO 80621
Estimated Value: $301,000 - $383,000
3
Beds
1
Bath
1,347
Sq Ft
$246/Sq Ft
Est. Value
About This Home
This home is located at 137 Mckinley Ave, Fort Lupton, CO 80621 and is currently estimated at $331,343, approximately $245 per square foot. 137 Mckinley Ave is a home located in Weld County with nearby schools including Leo William Butler Elementary School, Fort Lupton Middle School, and Fort Lupton High School.
Ownership History
Date
Name
Owned For
Owner Type
Purchase Details
Closed on
Jun 30, 2025
Sold by
Preston Grant T
Bought by
Merritt Victor Lee
Current Estimated Value
Home Financials for this Owner
Home Financials are based on the most recent Mortgage that was taken out on this home.
Original Mortgage
$295,850
Outstanding Balance
$295,345
Interest Rate
6.81%
Mortgage Type
New Conventional
Estimated Equity
$35,998
Purchase Details
Closed on
Aug 20, 2021
Sold by
Lefforge James L
Bought by
Preston Grant T
Home Financials for this Owner
Home Financials are based on the most recent Mortgage that was taken out on this home.
Original Mortgage
$304,000
Interest Rate
2.9%
Mortgage Type
New Conventional
Purchase Details
Closed on
Mar 26, 1992
Sold by
Luevano Antonio and Luevano Fabiola N
Bought by
Lefforge James I
Create a Home Valuation Report for This Property
The Home Valuation Report is an in-depth analysis detailing your home's value as well as a comparison with similar homes in the area
Home Values in the Area
Average Home Value in this Area
Purchase History
| Date | Buyer | Sale Price | Title Company |
|---|---|---|---|
| Merritt Victor Lee | $305,000 | Fidelity National Title | |
| Preston Grant T | $320,000 | Land Title Guarantee Co | |
| Lefforge James I | $41,000 | -- |
Source: Public Records
Mortgage History
| Date | Status | Borrower | Loan Amount |
|---|---|---|---|
| Open | Merritt Victor Lee | $295,850 | |
| Previous Owner | Preston Grant T | $304,000 |
Source: Public Records
Tax History Compared to Growth
Tax History
| Year | Tax Paid | Tax Assessment Tax Assessment Total Assessment is a certain percentage of the fair market value that is determined by local assessors to be the total taxable value of land and additions on the property. | Land | Improvement |
|---|---|---|---|---|
| 2025 | $1,668 | $18,110 | $3,460 | $14,650 |
| 2024 | $1,668 | $18,110 | $3,460 | $14,650 |
| 2023 | $1,478 | $21,120 | $3,740 | $17,380 |
| 2022 | $1,432 | $15,850 | $1,920 | $13,930 |
| 2021 | $1,626 | $16,210 | $1,980 | $14,230 |
| 2020 | $1,302 | $14,580 | $1,920 | $12,660 |
| 2019 | $1,296 | $14,580 | $1,920 | $12,660 |
| 2018 | $1,001 | $11,230 | $1,800 | $9,430 |
| 2017 | $1,048 | $11,230 | $1,800 | $9,430 |
| 2016 | $618 | $6,990 | $1,190 | $5,800 |
| 2015 | $567 | $6,990 | $1,190 | $5,800 |
| 2014 | $372 | $4,300 | $1,190 | $3,110 |
Source: Public Records
Map
Nearby Homes
- 147 Mckinley Ave
- 131 Mckinley Ave
- 153 Mckinley Ave
- 119 Mckinley Ave
- 120 Mckinley Ave
- 146 Mckinley Ave
- 429 1st St
- 114 Mckinley Ave
- 154 Mckinley Ave
- 451 2nd St
- 205 Mckinley Ave
- 118 Mckinley Ave
- 100 Mckinley Ave
- 505 2nd St
- 215 Mckinley Ave
- 417 2nd St
- 0 State Highway 52
- 411 2nd St
- 204 Mckinley Ave
- 401 2nd St