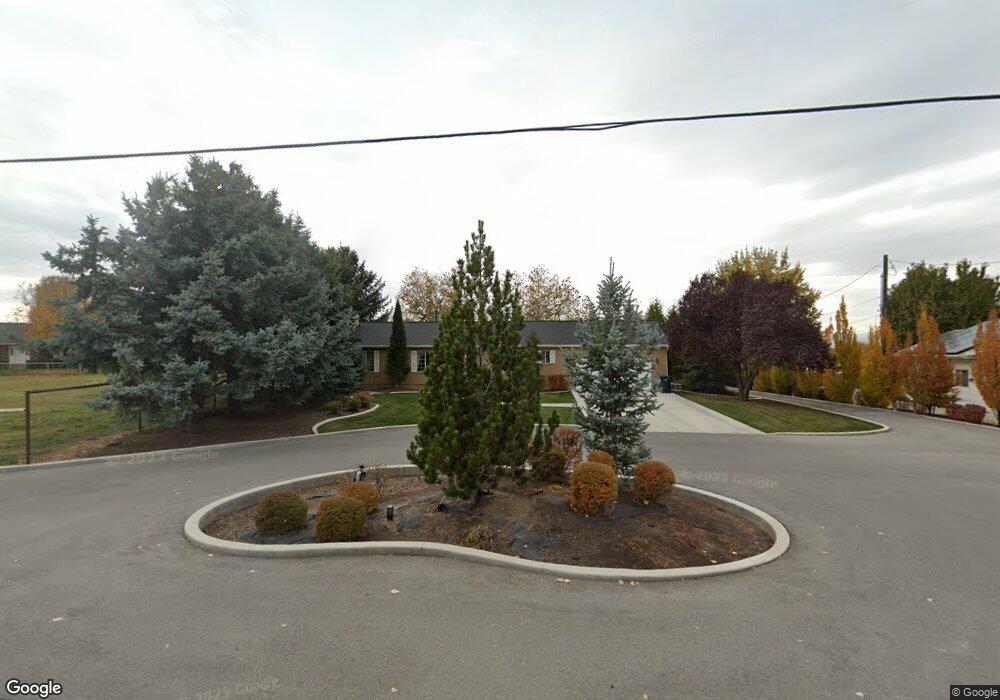
137 N 400 W Lindon, UT 84042
Estimated Value: $980,000 - $1,262,349
4
Beds
3
Baths
3,132
Sq Ft
$358/Sq Ft
Est. Value
About This Home
This home is located at 137 N 400 W, Lindon, UT 84042 and is currently estimated at $1,121,175, approximately $357 per square foot. 137 N 400 W is a home located in Utah County with nearby schools including Aspen Elementary School, Oak Canyon Junior High School, and Pleasant Grove High School.
Ownership History
Date
Name
Owned For
Owner Type
Purchase Details
Closed on
Mar 22, 2018
Sold by
Freughton Chad and Freughton Jennifer
Bought by
Fraughton Chad K and Fraughton Jennifer S
Current Estimated Value
Purchase Details
Closed on
Aug 16, 2017
Sold by
Fraughton Chad K and Fraughton Jennifer S
Bought by
Fraughton Chad K and Fraughton Jennifer S
Purchase Details
Closed on
May 6, 2016
Sold by
Norton Hadlock Rhea Dell and Rhea Dell Norton Hadlock Famil
Bought by
Fraughton Chad and Fraughton Jennifer
Home Financials for this Owner
Home Financials are based on the most recent Mortgage that was taken out on this home.
Original Mortgage
$412,500
Outstanding Balance
$327,520
Interest Rate
3.58%
Estimated Equity
$793,655
Purchase Details
Closed on
Oct 28, 2015
Sold by
Hadlock Rhea
Bought by
Hadlock Rhea Dell Norton and Rhea Dell Norton Hadlock Famil
Create a Home Valuation Report for This Property
The Home Valuation Report is an in-depth analysis detailing your home's value as well as a comparison with similar homes in the area
Home Values in the Area
Average Home Value in this Area
Purchase History
| Date | Buyer | Sale Price | Title Company |
|---|---|---|---|
| Fraughton Chad K | -- | None Available | |
| Fraughton Chad K | -- | None Available | |
| Fraughton Chad | -- | Provo Land Title Co | |
| Hadlock Rhea Dell Norton | -- | None Available |
Source: Public Records
Mortgage History
| Date | Status | Borrower | Loan Amount |
|---|---|---|---|
| Open | Fraughton Chad | $412,500 |
Source: Public Records
Tax History
| Year | Tax Paid | Tax Assessment Tax Assessment Total Assessment is a certain percentage of the fair market value that is determined by local assessors to be the total taxable value of land and additions on the property. | Land | Improvement |
|---|---|---|---|---|
| 2025 | $5,211 | $683,000 | -- | -- |
| 2024 | $5,211 | $642,340 | $0 | $0 |
| 2023 | $4,917 | $651,140 | $0 | $0 |
| 2022 | $5,262 | $970,600 | $631,900 | $338,700 |
| 2021 | $3,974 | $633,200 | $364,400 | $268,800 |
| 2020 | $3,701 | $581,600 | $328,000 | $253,600 |
| 2019 | $3,353 | $543,100 | $308,000 | $235,100 |
| 2018 | $3,285 | $492,400 | $288,000 | $204,400 |
| 2017 | $3,141 | $314,485 | $0 | $0 |
| 2016 | $2,710 | $250,975 | $0 | $0 |
| 2015 | $2,866 | $288,100 | $0 | $0 |
| 2014 | $2,798 | $242,650 | $0 | $0 |
Source: Public Records
Map
Nearby Homes
Your Personal Tour Guide
Ask me questions while you tour the home.