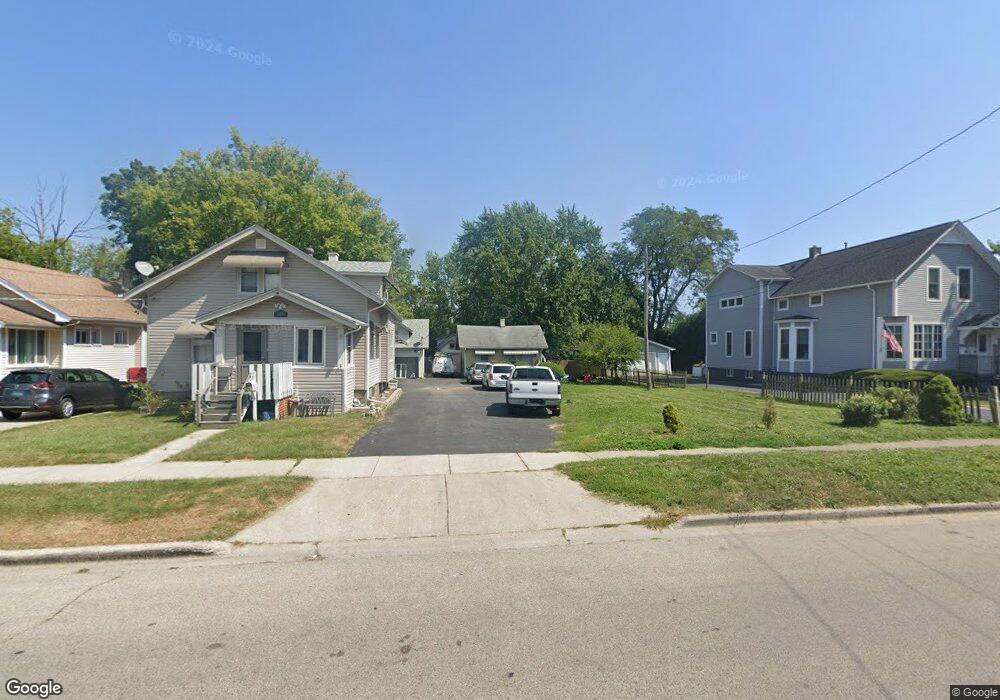
137 S Butrick St Waukegan, IL 60085
West Waukegan NeighborhoodEstimated Value: $139,000 - $167,077
2
Beds
1
Bath
642
Sq Ft
$230/Sq Ft
Est. Value
About This Home
This home is located at 137 S Butrick St, Waukegan, IL 60085 and is currently estimated at $147,769, approximately $230 per square foot. 137 S Butrick St is a home located in Lake County with nearby schools including Washington Elementary School, Robert E. Abbott Middle School, and Waukegan High School.
Ownership History
Date
Name
Owned For
Owner Type
Purchase Details
Closed on
May 1, 2011
Sold by
Secretary Of Housing & Urban Development
Bought by
Zeldovich Edward D and Zeldovich Sandra J
Current Estimated Value
Purchase Details
Closed on
Apr 20, 2010
Sold by
Brigham Dave and Bac Home Loans Servicing Lp
Bought by
Secretary Of Housing & Urban Development
Purchase Details
Closed on
Nov 2, 2007
Sold by
Chavarria Juan and Chavarria Jolene
Bought by
Brigham Dave
Home Financials for this Owner
Home Financials are based on the most recent Mortgage that was taken out on this home.
Original Mortgage
$94,024
Interest Rate
6.31%
Mortgage Type
FHA
Purchase Details
Closed on
Mar 24, 2000
Sold by
Binning Stanley
Bought by
Chavarria Juan and Chavarria Jolene
Purchase Details
Closed on
Feb 22, 2000
Sold by
Regent Investments Inc
Bought by
Binning Stanley
Create a Home Valuation Report for This Property
The Home Valuation Report is an in-depth analysis detailing your home's value as well as a comparison with similar homes in the area
Home Values in the Area
Average Home Value in this Area
Purchase History
| Date | Buyer | Sale Price | Title Company |
|---|---|---|---|
| Zeldovich Edward D | -- | Stewart Title Company | |
| Secretary Of Housing & Urban Development | -- | None Available | |
| Brigham Dave | $95,500 | Baird & Warner Title Service | |
| Chavarria Juan | $40,000 | -- | |
| Binning Stanley | $24,500 | -- |
Source: Public Records
Mortgage History
| Date | Status | Borrower | Loan Amount |
|---|---|---|---|
| Previous Owner | Brigham Dave | $94,024 |
Source: Public Records
Tax History Compared to Growth
Tax History
| Year | Tax Paid | Tax Assessment Tax Assessment Total Assessment is a certain percentage of the fair market value that is determined by local assessors to be the total taxable value of land and additions on the property. | Land | Improvement |
|---|---|---|---|---|
| 2024 | $3,604 | $36,719 | $14,943 | $21,776 |
| 2023 | $3,291 | $38,222 | $13,367 | $24,855 |
| 2022 | $3,291 | $33,659 | $14,128 | $19,531 |
| 2021 | $2,962 | $28,406 | $12,152 | $16,254 |
| 2020 | $3,000 | $26,464 | $11,321 | $15,143 |
| 2019 | $3,019 | $24,250 | $10,374 | $13,876 |
| 2018 | $2,367 | $18,311 | $11,747 | $6,564 |
| 2017 | $2,304 | $16,200 | $10,393 | $5,807 |
| 2016 | $2,175 | $16,340 | $9,031 | $7,309 |
| 2015 | $2,128 | $14,625 | $8,083 | $6,542 |
| 2014 | $1,344 | $8,544 | $4,369 | $4,175 |
| 2012 | $932 | $12,039 | $4,733 | $7,306 |
Source: Public Records
Map
Nearby Homes
- 1521 Catalpa Ave
- 446 S Jackson St
- 304 Powell Ave
- 1416 Hamilton Ct
- 23 N Jackson St
- 305 Besley Place
- 408 Besley Place
- 613 Clarke Ave
- 49 S Lewis Ave
- 610 Bluff St
- 215 S Park Ave
- 613 Washington St
- 557 W Water St
- 28 N Saint James St
- 502 Belvidere Rd
- 600 Sunderlin St
- 522 George Ave
- 910 Cummings Ave
- 515 George Ave
- 12601 W Atlantic Ave
- 139 S Butrick St
- 129 S Butrick St
- 141 S Butrick St
- 127 S Butrick St
- 1312 Melrose Ave Unit 212
- 1312 Melrose Ave Unit 211
- 1312 Melrose Ave Unit 210
- 1312 Melrose Ave Unit 209
- 1312 Melrose Ave Unit 208
- 1312 Melrose Ave Unit 207
- 1312 Melrose Ave Unit 206
- 1312 Melrose Ave Unit 205
- 1312 Melrose Ave Unit 204
- 1312 Melrose Ave Unit 203
- 1312 Melrose Ave Unit 202
- 1312 Melrose Ave Unit 201
- 1312 Melrose Ave Unit 200
- 1312 Melrose Ave Unit 112
- 1312 Melrose Ave Unit 110
- 1312 Melrose Ave Unit 109