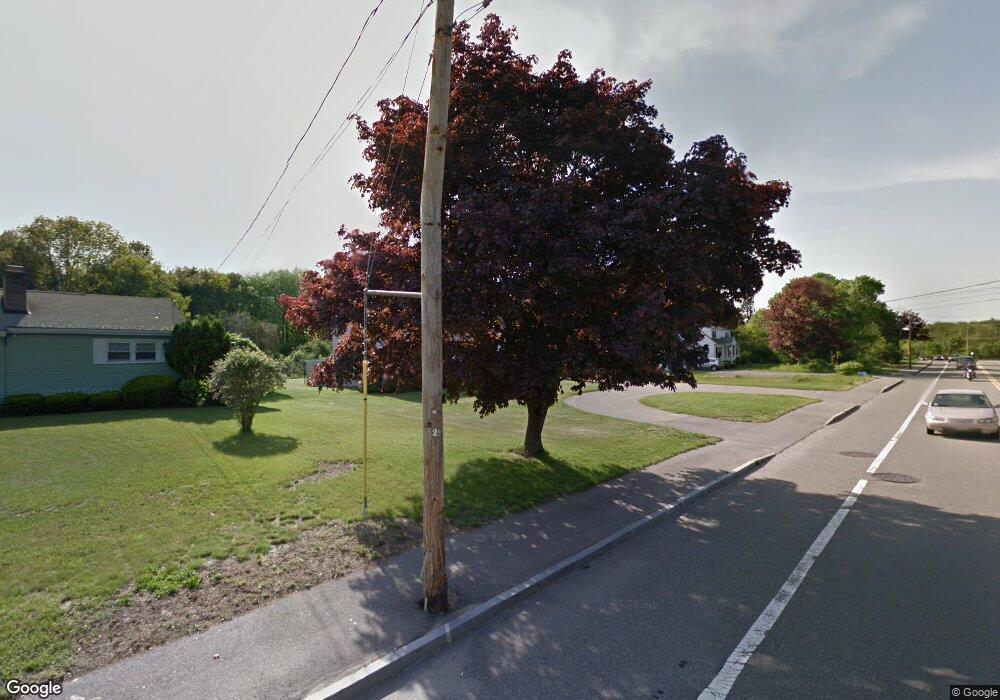
137 S Main St West Bridgewater, MA 02379
Estimated Value: $578,000 - $679,000
4
Beds
2
Baths
2,258
Sq Ft
$282/Sq Ft
Est. Value
About This Home
This home is located at 137 S Main St, West Bridgewater, MA 02379 and is currently estimated at $636,827, approximately $282 per square foot. 137 S Main St is a home located in Plymouth County with nearby schools including Spring Street Elementary School, Howard Elementary School, and Rose L. MacDonald Elementary School.
Ownership History
Date
Name
Owned For
Owner Type
Purchase Details
Closed on
Jan 16, 2007
Sold by
Cruz Edward F and Cruz Edward M
Bought by
Cruz Edward M and Courtemarche Marybeth
Current Estimated Value
Purchase Details
Closed on
Mar 2, 2004
Sold by
Cruz Edward F and Cruz Edward M
Bought by
Cruz Edward F
Home Financials for this Owner
Home Financials are based on the most recent Mortgage that was taken out on this home.
Original Mortgage
$225,000
Interest Rate
5.71%
Purchase Details
Closed on
Apr 17, 2003
Sold by
Cruz Edward F
Bought by
Cruz Edward F and Cruz Timothy J
Create a Home Valuation Report for This Property
The Home Valuation Report is an in-depth analysis detailing your home's value as well as a comparison with similar homes in the area
Home Values in the Area
Average Home Value in this Area
Purchase History
| Date | Buyer | Sale Price | Title Company |
|---|---|---|---|
| Cruz Edward M | -- | -- | |
| Cruz Edward F | -- | -- | |
| Cruz Edward F | -- | -- |
Source: Public Records
Mortgage History
| Date | Status | Borrower | Loan Amount |
|---|---|---|---|
| Previous Owner | Cruz Edward F | $225,000 | |
| Previous Owner | Cruz Edward F | $33,700 | |
| Previous Owner | Cruz Edward F | $120,000 |
Source: Public Records
Tax History Compared to Growth
Tax History
| Year | Tax Paid | Tax Assessment Tax Assessment Total Assessment is a certain percentage of the fair market value that is determined by local assessors to be the total taxable value of land and additions on the property. | Land | Improvement |
|---|---|---|---|---|
| 2025 | $6,784 | $496,300 | $207,900 | $288,400 |
| 2024 | $6,313 | $445,500 | $188,500 | $257,000 |
| 2023 | $5,668 | $368,800 | $163,200 | $205,600 |
| 2022 | $5,401 | $333,000 | $153,500 | $179,500 |
| 2021 | $5,367 | $321,200 | $153,500 | $167,700 |
| 2020 | $5,258 | $321,200 | $153,500 | $167,700 |
| 2019 | $5,260 | $318,200 | $153,500 | $164,700 |
| 2018 | $9,563 | $303,000 | $145,700 | $157,300 |
| 2017 | $5,062 | $285,500 | $132,100 | $153,400 |
| 2016 | $4,972 | $276,200 | $122,800 | $153,400 |
| 2015 | $4,654 | $261,300 | $122,800 | $138,500 |
| 2014 | $4,261 | $258,400 | $122,800 | $135,600 |
Source: Public Records
Map
Nearby Homes