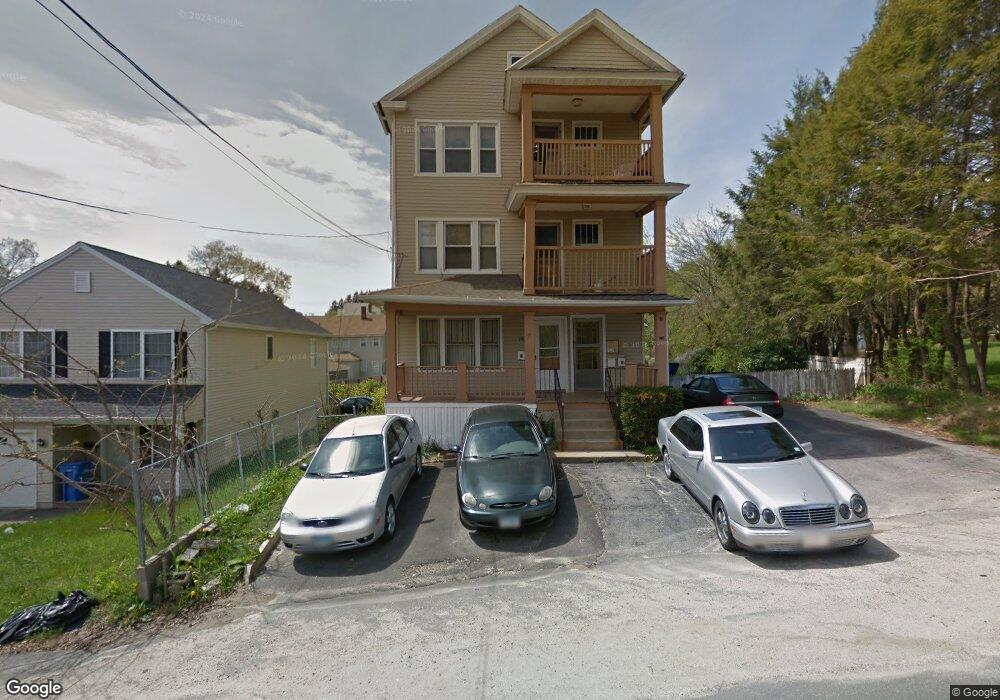
137 Tudor St Unit 2nd Waterbury, CT 06704
North End District NeighborhoodEstimated Value: $418,000 - $457,000
2
Beds
1
Bath
3,264
Sq Ft
$133/Sq Ft
Est. Value
About This Home
This home is located at 137 Tudor St Unit 2nd, Waterbury, CT 06704 and is currently estimated at $435,667, approximately $133 per square foot. 137 Tudor St Unit 2nd is a home located in New Haven County with nearby schools including Wilby High School, Alpha & Omega Christian Academy, and Yeshiva Gedolah.
Ownership History
Date
Name
Owned For
Owner Type
Purchase Details
Closed on
Jun 4, 2025
Sold by
Lee Mallorie W
Bought by
Taylor Jordan T and Taylor Lee
Current Estimated Value
Purchase Details
Closed on
May 25, 2010
Sold by
Lee Mallorie W
Bought by
Lee Mallorie W and Lee Nathan R
Purchase Details
Closed on
Feb 23, 2009
Sold by
Us Bank Na
Bought by
Lee Mallorie W
Purchase Details
Closed on
Mar 8, 2006
Sold by
Simmons John and Simmons Isabel
Bought by
Janik Irena
Home Financials for this Owner
Home Financials are based on the most recent Mortgage that was taken out on this home.
Original Mortgage
$26,150
Interest Rate
6.34%
Create a Home Valuation Report for This Property
The Home Valuation Report is an in-depth analysis detailing your home's value as well as a comparison with similar homes in the area
Home Values in the Area
Average Home Value in this Area
Purchase History
| Date | Buyer | Sale Price | Title Company |
|---|---|---|---|
| Taylor Jordan T | -- | None Available | |
| Taylor Jordan T | -- | None Available | |
| Lee Mallorie W | -- | -- | |
| Lee Mallorie W | -- | -- | |
| Lee Mallorie W | $85,000 | -- | |
| Lee Mallorie W | $85,000 | -- | |
| Janik Irena | $215,000 | -- | |
| Janik Irena | $215,000 | -- |
Source: Public Records
Mortgage History
| Date | Status | Borrower | Loan Amount |
|---|---|---|---|
| Previous Owner | Janik Irena | $26,150 | |
| Previous Owner | Janik Irena | $172,000 |
Source: Public Records
Tax History Compared to Growth
Tax History
| Year | Tax Paid | Tax Assessment Tax Assessment Total Assessment is a certain percentage of the fair market value that is determined by local assessors to be the total taxable value of land and additions on the property. | Land | Improvement |
|---|---|---|---|---|
| 2025 | $7,894 | $175,490 | $17,710 | $157,780 |
| 2024 | $8,676 | $175,490 | $17,710 | $157,780 |
| 2023 | $9,510 | $175,490 | $17,710 | $157,780 |
| 2022 | $5,260 | $87,360 | $17,740 | $69,620 |
| 2021 | $5,260 | $87,360 | $17,740 | $69,620 |
| 2020 | $5,260 | $87,360 | $17,740 | $69,620 |
| 2019 | $5,260 | $87,360 | $17,740 | $69,620 |
| 2018 | $5,260 | $87,360 | $17,740 | $69,620 |
| 2017 | $5,292 | $87,900 | $17,740 | $70,160 |
| 2016 | $5,292 | $87,900 | $17,740 | $70,160 |
| 2015 | $5,118 | $87,900 | $17,740 | $70,160 |
| 2014 | $5,118 | $87,900 | $17,740 | $70,160 |
Source: Public Records
Map
Nearby Homes
- 198 Tudor St
- 82 Hotchkiss St
- 78 Tudor St
- 213 Easton Ave
- 255 Hill St
- 48 Matthews St
- 231 Hauser St
- 981 N Main St
- 975 N Main St
- 53 Hamden Ave
- 81 Easton Ave
- 9 Brewster St
- 69 Easton Ave
- 147 Hamden Ave Unit I
- 147 Hamden Ave Unit H
- 103 Hamden Ave Unit G
- 103 Hamden Ave Unit B
- 92 Hamden Ave Unit 4
- 500 Hill St
- 456 N Walnut St