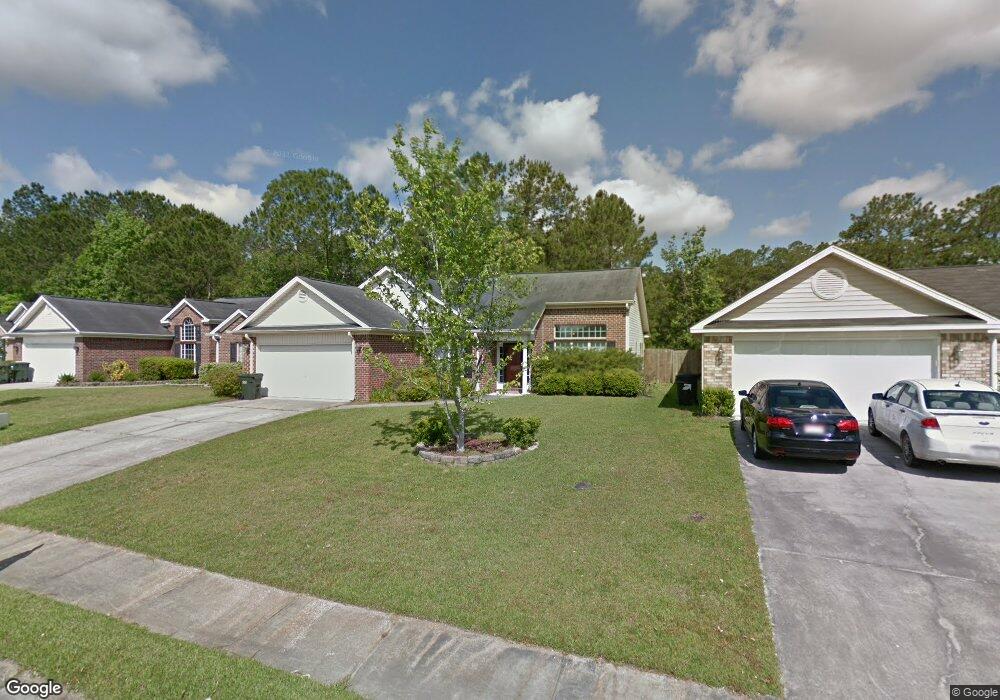
137 W Tisbury Ln Unit 549 Pooler, GA 31322
Southwest Chatham NeighborhoodEstimated Value: $296,644 - $315,000
3
Beds
2
Baths
1,398
Sq Ft
$217/Sq Ft
Est. Value
About This Home
This home is located at 137 W Tisbury Ln Unit 549, Pooler, GA 31322 and is currently estimated at $303,411, approximately $217 per square foot. 137 W Tisbury Ln Unit 549 is a home located in Chatham County with nearby schools including West Chatham Elementary School, West Chatham Middle School, and New Hampstead High School.
Ownership History
Date
Name
Owned For
Owner Type
Purchase Details
Closed on
May 7, 2025
Sold by
Wingen John Patrick
Bought by
Wu Xiangchi and Yang Yuying
Current Estimated Value
Home Financials for this Owner
Home Financials are based on the most recent Mortgage that was taken out on this home.
Original Mortgage
$217,000
Interest Rate
6.62%
Mortgage Type
New Conventional
Purchase Details
Closed on
Dec 22, 2020
Sold by
Garcia Johnny
Bought by
Wingen John Patrick
Home Financials for this Owner
Home Financials are based on the most recent Mortgage that was taken out on this home.
Original Mortgage
$188,232
Interest Rate
2.7%
Mortgage Type
VA
Purchase Details
Closed on
May 26, 2016
Sold by
Johnson Stephanie C
Bought by
Garcia Johnny
Home Financials for this Owner
Home Financials are based on the most recent Mortgage that was taken out on this home.
Original Mortgage
$153,122
Interest Rate
3.66%
Mortgage Type
VA
Purchase Details
Closed on
Aug 19, 2005
Sold by
Not Provided
Bought by
Johnson Stephanie C and Johnson William
Home Financials for this Owner
Home Financials are based on the most recent Mortgage that was taken out on this home.
Original Mortgage
$26,600
Interest Rate
5.64%
Mortgage Type
New Conventional
Create a Home Valuation Report for This Property
The Home Valuation Report is an in-depth analysis detailing your home's value as well as a comparison with similar homes in the area
Home Values in the Area
Average Home Value in this Area
Purchase History
| Date | Buyer | Sale Price | Title Company |
|---|---|---|---|
| Wu Xiangchi | $310,000 | -- | |
| Wingen John Patrick | $184,000 | -- | |
| Garcia Johnny | $149,900 | -- | |
| Johnson Stephanie C | -- | -- |
Source: Public Records
Mortgage History
| Date | Status | Borrower | Loan Amount |
|---|---|---|---|
| Previous Owner | Wu Xiangchi | $217,000 | |
| Previous Owner | Wingen John Patrick | $188,232 | |
| Previous Owner | Garcia Johnny | $153,122 | |
| Previous Owner | Johnson Stephanie C | $26,600 |
Source: Public Records
Tax History Compared to Growth
Tax History
| Year | Tax Paid | Tax Assessment Tax Assessment Total Assessment is a certain percentage of the fair market value that is determined by local assessors to be the total taxable value of land and additions on the property. | Land | Improvement |
|---|---|---|---|---|
| 2025 | $4,222 | $117,200 | $24,000 | $93,200 |
| 2024 | $4,222 | $105,080 | $18,000 | $87,080 |
| 2023 | $3,164 | $90,560 | $18,000 | $72,560 |
| 2022 | $2,356 | $75,520 | $12,000 | $63,520 |
| 2021 | $2,471 | $66,120 | $12,000 | $54,120 |
| 2020 | $2,364 | $64,520 | $12,000 | $52,520 |
| 2019 | $2,475 | $64,800 | $12,000 | $52,800 |
| 2018 | $1,860 | $62,760 | $12,000 | $50,760 |
| 2017 | $1,823 | $55,280 | $10,000 | $45,280 |
| 2016 | $1,891 | $54,720 | $10,000 | $44,720 |
| 2015 | $1,655 | $54,560 | $10,000 | $44,560 |
| 2014 | $2,421 | $55,200 | $0 | $0 |
Source: Public Records
Map
Nearby Homes
- 306 Katama Way
- 115 Aquinnah Dr
- 111 Bluelake Blvd
- 213 Katama Way
- 10 Vineyard Haven Dr
- 10 Katama Way
- 11 Canal Bank Rd
- 141 Bluelake Blvd
- 9 Grenwick Ln
- 153 Berwick Lakes Blvd
- 101 Blue Gill Ln
- 188 Berwick Lakes Blvd
- 1 Bluelake Blvd
- 12 Stalwick Dr
- 29 Parish Way
- 153 Hamilton Grove Dr
- 12 Cottingham Way
- 104 Canal Cove
- 21 Cottingham Way
- 122 Charles Ln
- 137 W Tisbury Ln
- 139 W Tisbury Ln
- 135 W Tisbury Ln
- 141 W Tisbury Ln
- 133 W Tisbury Ln
- 138 W Tisbury Ln
- 136 W Tisbury Ln
- 140 W Tisbury Ln
- 131 W Tisbury Ln
- 134 W Tisbury Ln
- 142 W Tisbury Ln Unit ID1369218P
- 142 W Tisbury Ln
- 142 W Tisbury Ln Unit 544
- 145 W Tisbury Ln
- 144 W Tisbury Ln
- 104 Aquinnah Dr
- 129 W Tisbury Ln
- 132 W Tisbury Ln
- 146 W Tisbury Ln
- 106 Aquinnah Dr