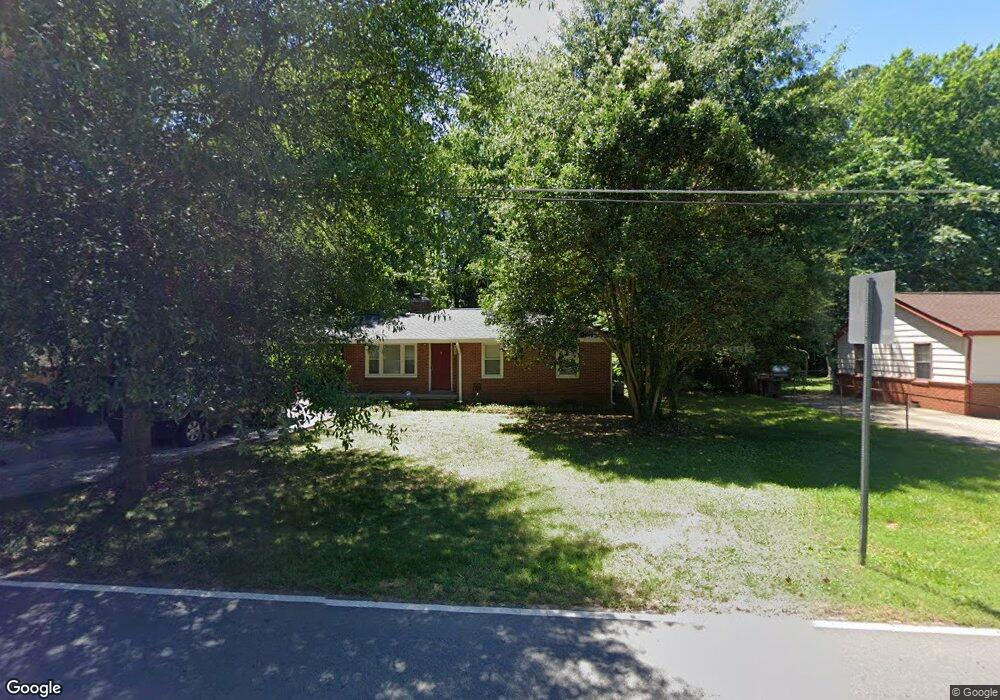
137 Weston Rd Garner, NC 27529
Estimated Value: $196,000 - $241,393
3
Beds
1
Bath
947
Sq Ft
$237/Sq Ft
Est. Value
About This Home
This home is located at 137 Weston Rd, Garner, NC 27529 and is currently estimated at $224,848, approximately $237 per square foot. 137 Weston Rd is a home located in Wake County with nearby schools including Creech Road Elementary School, North Garner Middle, and Garner High.
Ownership History
Date
Name
Owned For
Owner Type
Purchase Details
Closed on
Dec 27, 2021
Sold by
Willingham Sean M and Willingham Caroline K
Bought by
Willingham John L
Current Estimated Value
Purchase Details
Closed on
Feb 6, 2017
Sold by
Pehlman Briana J and Sheaves James Daryl
Bought by
Willingham Sean M and Willingham Caroline K
Home Financials for this Owner
Home Financials are based on the most recent Mortgage that was taken out on this home.
Original Mortgage
$84,000
Outstanding Balance
$69,742
Interest Rate
4.3%
Mortgage Type
New Conventional
Estimated Equity
$155,106
Purchase Details
Closed on
May 15, 2007
Sold by
Manne Lakshmana Rao and Manne Lakshmi N
Bought by
Pehlman Briana J
Home Financials for this Owner
Home Financials are based on the most recent Mortgage that was taken out on this home.
Original Mortgage
$67,500
Interest Rate
6.11%
Mortgage Type
Purchase Money Mortgage
Create a Home Valuation Report for This Property
The Home Valuation Report is an in-depth analysis detailing your home's value as well as a comparison with similar homes in the area
Home Values in the Area
Average Home Value in this Area
Purchase History
| Date | Buyer | Sale Price | Title Company |
|---|---|---|---|
| Willingham John L | -- | None Available | |
| Willingham Sean M | $105,000 | None Available | |
| Pehlman Briana J | $91,000 | Blackacre Title Ins Agency |
Source: Public Records
Mortgage History
| Date | Status | Borrower | Loan Amount |
|---|---|---|---|
| Open | Willingham Sean M | $84,000 | |
| Previous Owner | Pehlman Briana J | $67,500 | |
| Previous Owner | Pehlman Briana J | $22,500 |
Source: Public Records
Tax History Compared to Growth
Tax History
| Year | Tax Paid | Tax Assessment Tax Assessment Total Assessment is a certain percentage of the fair market value that is determined by local assessors to be the total taxable value of land and additions on the property. | Land | Improvement |
|---|---|---|---|---|
| 2025 | $2,074 | $198,031 | $95,000 | $103,031 |
| 2024 | $2,067 | $198,031 | $95,000 | $103,031 |
Source: Public Records
Map
Nearby Homes
- 104 Westonridge Run
- 900 Powell Dr
- 901 Powell Dr
- 130 Parkhaven Ln
- Cobblestone Plan at Buffalo Towns
- Magnolia Plan at Buffalo Towns
- Greystone Plan at Buffalo Towns
- 130 Muirfield Ridge Dr
- 0 Dupree St
- 215 Harper St
- 117 Pearl St Unit 3
- 133 Pearl St Unit 7
- 137 Pearl St Unit 8
- 141 Pearl St Unit 9
- 145 Pearl St Unit 10
- 149 Pearl St Unit 11
- 153 Pearl St Unit 12
- 201 Creech Rd
- 131 Creech Rd
- 3904 Cobb St
- 139 Weston Rd
- 135 Weston Rd
- 133 Weston Rd
- 909 Powell Dr
- 911 Powell Dr
- 907 Powell Dr
- 131 Weston Rd
- 913 Powell Dr
- 143 Weston Rd
- 915 Powell Dr
- 129 Weston Rd
- 905 Powell Dr
- 101 Westonridge Run
- 105 Westonridge Run
- 917 Powell Dr
- 109 Westonridge Run
- 127 Weston Rd
- 132 Weston Rd
- 113 Westonridge Run
- 902 Powell Dr