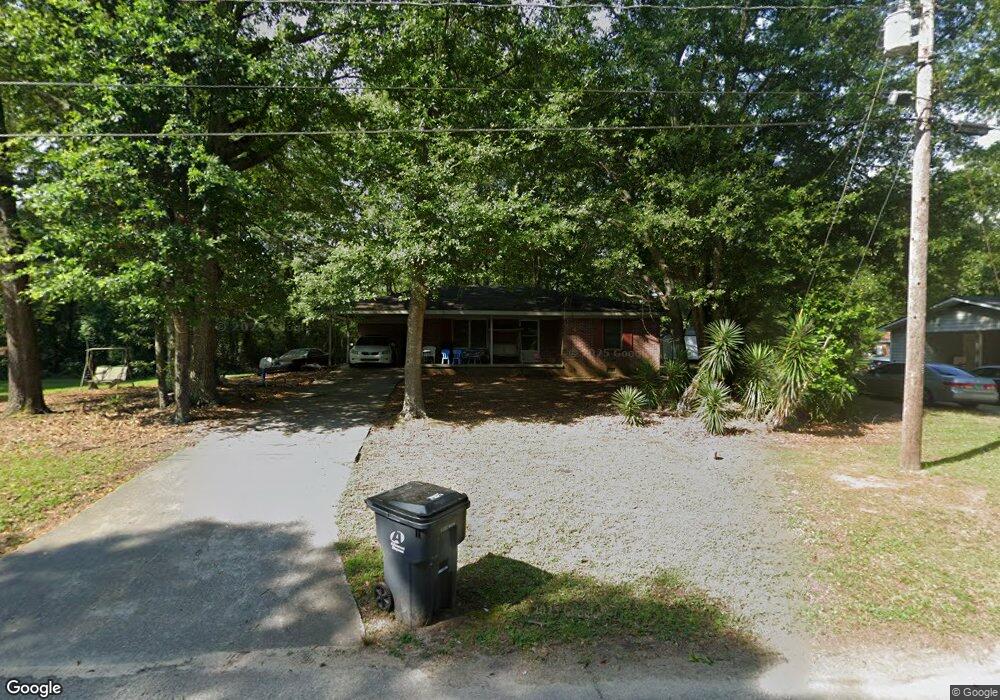
137 Williams St Rutledge, GA 30663
Estimated Value: $124,213 - $224,000
--
Bed
1
Bath
970
Sq Ft
$181/Sq Ft
Est. Value
About This Home
This home is located at 137 Williams St, Rutledge, GA 30663 and is currently estimated at $175,303, approximately $180 per square foot. 137 Williams St is a home located in Morgan County with nearby schools including Morgan County Primary School, Morgan County Elementary School, and Morgan County Middle School.
Ownership History
Date
Name
Owned For
Owner Type
Purchase Details
Closed on
Nov 16, 2009
Sold by
Carnes Larry D
Bought by
Ballard Sharon
Current Estimated Value
Home Financials for this Owner
Home Financials are based on the most recent Mortgage that was taken out on this home.
Original Mortgage
$63,822
Outstanding Balance
$41,206
Interest Rate
4.94%
Mortgage Type
FHA
Estimated Equity
$134,097
Purchase Details
Closed on
Oct 2, 2000
Sold by
Morris Belinda J
Bought by
Carnes Larry D and Carnes Deb
Purchase Details
Closed on
Nov 4, 1999
Sold by
Morris Paul A
Bought by
Morris Belinda J
Purchase Details
Closed on
Sep 30, 1996
Sold by
Thomas Lizzie F and Thomas K
Bought by
Morris Paul Anthony
Purchase Details
Closed on
Jan 15, 1988
Sold by
Griffin J M
Bought by
Morris Paul A
Purchase Details
Closed on
Aug 21, 1987
Sold by
Griffin J M
Bought by
Morris Paul A
Create a Home Valuation Report for This Property
The Home Valuation Report is an in-depth analysis detailing your home's value as well as a comparison with similar homes in the area
Home Values in the Area
Average Home Value in this Area
Purchase History
| Date | Buyer | Sale Price | Title Company |
|---|---|---|---|
| Ballard Sharon | $65,000 | -- | |
| Carnes Larry D | -- | -- | |
| Morris Belinda J | -- | -- | |
| Morris Paul Anthony | -- | -- | |
| Morris Paul A | -- | -- | |
| Morris Paul A | $2,500 | -- |
Source: Public Records
Mortgage History
| Date | Status | Borrower | Loan Amount |
|---|---|---|---|
| Open | Ballard Sharon | $63,822 |
Source: Public Records
Tax History Compared to Growth
Tax History
| Year | Tax Paid | Tax Assessment Tax Assessment Total Assessment is a certain percentage of the fair market value that is determined by local assessors to be the total taxable value of land and additions on the property. | Land | Improvement |
|---|---|---|---|---|
| 2025 | $1,119 | $44,080 | $5,600 | $38,480 |
| 2024 | $1,023 | $39,644 | $4,800 | $34,844 |
| 2023 | $915 | $34,394 | $3,200 | $31,194 |
| 2022 | $893 | $32,284 | $2,800 | $29,484 |
| 2021 | $860 | $30,958 | $2,800 | $28,158 |
| 2020 | $857 | $30,558 | $2,400 | $28,158 |
| 2019 | $870 | $30,558 | $2,400 | $28,158 |
| 2018 | $883 | $30,558 | $2,400 | $28,158 |
| 2017 | $861 | $29,376 | $2,400 | $26,976 |
| 2016 | $784 | $26,042 | $2,400 | $23,642 |
| 2015 | $796 | $26,080 | $2,400 | $23,680 |
| 2014 | $603 | $20,240 | $2,400 | $17,840 |
| 2013 | -- | $16,480 | $2,400 | $14,080 |
Source: Public Records
Map
Nearby Homes
- 0 Fairplay St Unit 10637174
- 224 Hollis St
- 120 Hidden Falls Ct
- 0 Hawkins Academy Rd Unit 10561655
- 5761 W Dixie Hwy
- 294 Tuscany Dr
- 5521 Atlanta Hwy
- 0 Reese Rd Unit 10622381
- 0 Reese Rd Unit 25651133
- 0 W Dixie Hwy Unit 10499573
- 1151 Fears Rd
- 5841 Atlanta Hwy
- 5187 Parkview Rd
- 3641 Davis Academy Rd
- 25 Browning Shoals Rd
- 1310 Deerwood Dr
- 745 Amber Lakes Ct Unit 2
- 1031 Graham Dr
- 0 Double Bridges Rd Unit Madison GA 30650
- 00 Fears Rd
- 149 Williams St
- 110 Kelly St
- 119 Williams St
- 116 Kelly St
- 111 Kelly St
- 189 Fairplay St
- 140 Williams St
- 107 Kelly St
- 122 Mcdonough St
- 229 Fairplay St
- 207 Fairplay St
- 159 Williams St
- 104 Williams St
- 136 Mcdonough St
- 171 Fairplay St
- 171 Fairplay St
- 144 Mcdonough St
- 167 Williams St
- 158 Mc Donough St
- 150 Mcdonough St