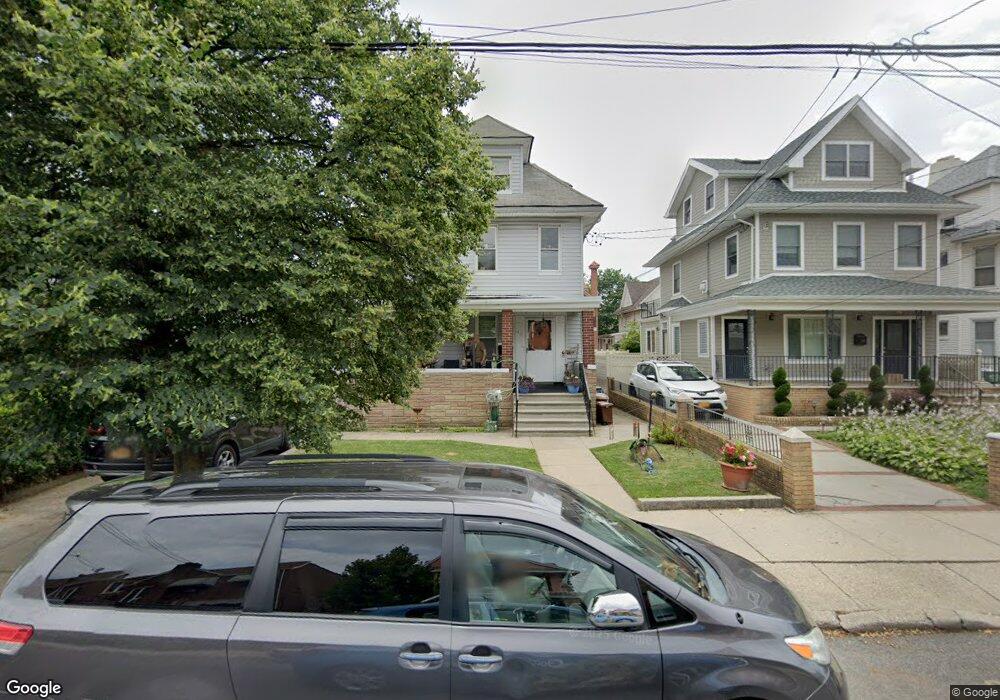
1370 72nd St Brooklyn, NY 11228
Dyker Heights NeighborhoodEstimated Value: $1,251,000 - $1,809,000
Studio
--
Bath
1,770
Sq Ft
$823/Sq Ft
Est. Value
About This Home
This home is located at 1370 72nd St, Brooklyn, NY 11228 and is currently estimated at $1,456,061, approximately $822 per square foot. 1370 72nd St is a home located in Kings County with nearby schools including P.S. 176 Ovington, IS 201 Madeleine Brennan Intermediate School, and New Utrecht High School.
Ownership History
Date
Name
Owned For
Owner Type
Purchase Details
Closed on
Feb 12, 2013
Sold by
Catalano Angelo and Gentile Josephine
Bought by
Bova Rosemary A
Current Estimated Value
Purchase Details
Closed on
Jul 15, 1999
Sold by
Bova Mary
Bought by
Bova Joseph and Bova Rosemary
Purchase Details
Closed on
Mar 6, 1995
Sold by
Catalano Serafina
Bought by
Catalano Angelo and Gentile Josephine
Create a Home Valuation Report for This Property
The Home Valuation Report is an in-depth analysis detailing your home's value as well as a comparison with similar homes in the area
Home Values in the Area
Average Home Value in this Area
Purchase History
| Date | Buyer | Sale Price | Title Company |
|---|---|---|---|
| Bova Rosemary A | $390,000 | -- | |
| Bova Rosemary A | $390,000 | -- | |
| Bova Joseph | -- | Fidelity National Title Ins | |
| Bova Joseph | -- | Fidelity National Title Ins | |
| Catalano Angelo | -- | Chicago Title Insurance Co | |
| Catalano Angelo | -- | Chicago Title Insurance Co |
Source: Public Records
Tax History
| Year | Tax Paid | Tax Assessment Tax Assessment Total Assessment is a certain percentage of the fair market value that is determined by local assessors to be the total taxable value of land and additions on the property. | Land | Improvement |
|---|---|---|---|---|
| 2025 | $4,504 | $87,180 | $24,540 | $62,640 |
| 2024 | $4,504 | $68,880 | $24,540 | $44,340 |
| 2023 | $9,470 | $73,860 | $24,540 | $49,320 |
| 2022 | $4,062 | $72,000 | $24,540 | $47,460 |
| 2021 | $4,314 | $75,360 | $24,540 | $50,820 |
| 2020 | $3,018 | $74,880 | $24,540 | $50,340 |
| 2019 | $3,913 | $63,180 | $24,540 | $38,640 |
| 2018 | $3,577 | $41,560 | $14,742 | $26,818 |
| 2017 | $3,371 | $39,412 | $16,516 | $22,896 |
| 2016 | $7,564 | $39,385 | $16,658 | $22,727 |
| 2015 | $4,265 | $37,156 | $18,869 | $18,287 |
| 2014 | $4,265 | $36,427 | $19,664 | $16,763 |
Source: Public Records
Map
Nearby Homes
Your Personal Tour Guide
Ask me questions while you tour the home.