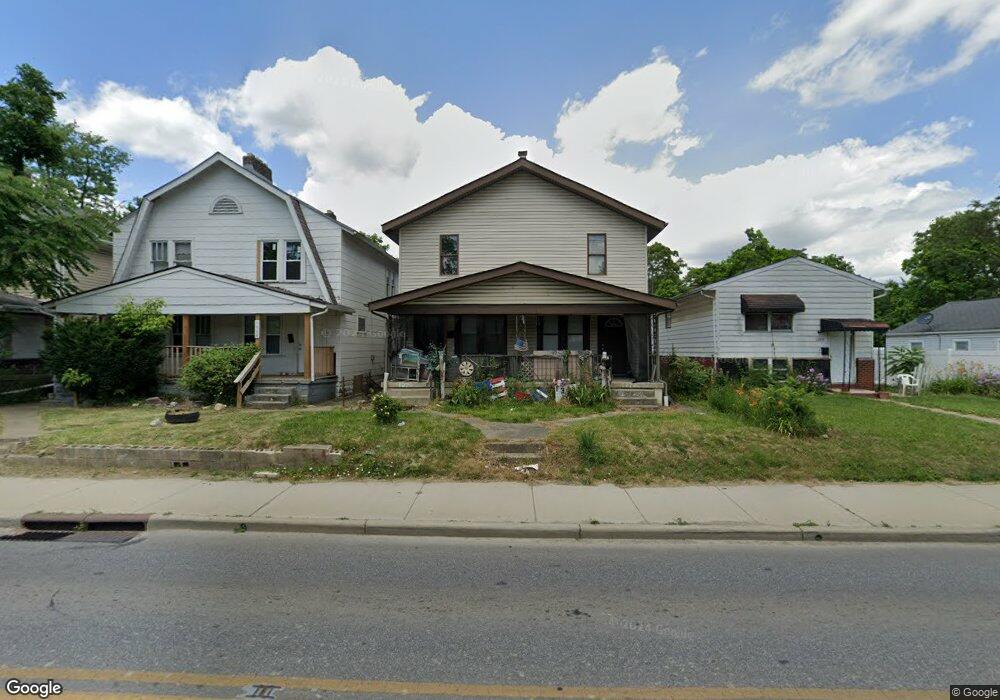
1370 E 17th Ave Unit 372 Columbus, OH 43211
South Linden NeighborhoodEstimated Value: $152,226 - $213,000
6
Beds
2
Baths
2,352
Sq Ft
$81/Sq Ft
Est. Value
About This Home
This home is located at 1370 E 17th Ave Unit 372, Columbus, OH 43211 and is currently estimated at $190,307, approximately $80 per square foot. 1370 E 17th Ave Unit 372 is a home located in Franklin County with nearby schools including Windsor Stem Acadmey, Linden-Mckinley Stem School On Arcadia, and North Columbus Preparatory Academy.
Ownership History
Date
Name
Owned For
Owner Type
Purchase Details
Closed on
Oct 23, 2013
Sold by
Hoehn Joseph
Bought by
Morefield Marvin
Current Estimated Value
Purchase Details
Closed on
Apr 10, 2008
Sold by
Dpm Properties 1 Llc
Bought by
Hoehm Joseph
Purchase Details
Closed on
Jan 17, 2008
Sold by
Wells Fargo Bank Na
Bought by
Dpm Properties 1 Llc
Purchase Details
Closed on
Dec 12, 2006
Sold by
Moore Leroy and Case #06Cve05 6073
Bought by
Wells Fargo Bank Na and Option One Woodbridge Loan Trust 2003-2
Purchase Details
Closed on
Mar 27, 1995
Sold by
Johnson Bruce A
Bought by
Moore Leroy and Moore Carolyn Y
Home Financials for this Owner
Home Financials are based on the most recent Mortgage that was taken out on this home.
Original Mortgage
$50,767
Interest Rate
8.82%
Mortgage Type
FHA
Purchase Details
Closed on
Oct 1, 1986
Purchase Details
Closed on
May 1, 1986
Create a Home Valuation Report for This Property
The Home Valuation Report is an in-depth analysis detailing your home's value as well as a comparison with similar homes in the area
Home Values in the Area
Average Home Value in this Area
Purchase History
We collect this data history from publicly available records. To have your information removed, we recommend requesting removal directly through your county’s website.
| Date | Buyer | Sale Price | Title Company |
|---|---|---|---|
| Morefield Marvin | $35,000 | None Available | |
| Hoehm Joseph | -- | Attorney | |
| Dpm Properties 1 Llc | $16,500 | Accutitle Agency Inc | |
| Wells Fargo Bank Na | $40,000 | None Available | |
| Moore Leroy | $50,340 | -- | |
| -- | $32,900 | -- | |
| -- | $20,000 | -- |
Source: Public Records
Mortgage History
We collect this data history from publicly available records. To have your information removed, we recommend requesting removal directly through your county’s website.
| Date | Status | Borrower | Loan Amount |
|---|---|---|---|
| Previous Owner | Moore Leroy | $50,767 |
Source: Public Records
Tax History
| Year | Tax Paid | Tax Assessment Tax Assessment Total Assessment is a certain percentage of the fair market value that is determined by local assessors to be the total taxable value of land and additions on the property. | Land | Improvement |
|---|---|---|---|---|
| 2025 | $3,284 | $47,400 | $5,920 | $41,480 |
| 2024 | $3,284 | $47,400 | $5,920 | $41,480 |
| 2023 | $2,295 | $47,390 | $5,915 | $41,475 |
| 2022 | $5,129 | $21,950 | $2,450 | $19,500 |
| 2021 | $2,082 | $21,950 | $2,450 | $19,500 |
| 2020 | $1,872 | $21,950 | $2,450 | $19,500 |
| 2019 | $1,525 | $18,270 | $2,030 | $16,240 |
| 2018 | $1,252 | $18,270 | $2,030 | $16,240 |
| 2017 | $1,202 | $18,270 | $2,030 | $16,240 |
| 2016 | $1,218 | $17,190 | $2,350 | $14,840 |
| 2015 | $1,220 | $17,190 | $2,350 | $14,840 |
| 2014 | $1,066 | $17,190 | $2,350 | $14,840 |
| 2013 | $583 | $19,075 | $2,590 | $16,485 |
Source: Public Records
Map
Nearby Homes
- 1369-1371 E 18th Ave
- 1315 E 18th Ave
- 1363 E 19th Ave
- 1433 E 19th Ave
- 1341 E 15th Ave
- 1249-1251 E 15th Ave
- 0 Windsor Ave
- 1673 Cleveland Ave
- 1386 E 22nd Ave
- 1157-1159 E 18th Ave
- 1303 E 22nd Ave
- 1258 E 21st Ave
- 1371 E 23rd Ave
- 1129 E 17th Ave
- 1265 E 22nd Ave
- 1384 E 23rd Ave
- 1111-1113 E 16th Ave
- 1266 E 22nd Ave
- 1121 Windsor Ave
- 1111 Windsor Ave
- 1370-1372 E 17th Ave
- 1370-1372 E 17th Ave Unit 72
- 1366 E 17th Ave Unit 368
- 1366 E 17th Ave Unit 68
- 1376 E 17th Ave
- 1362 E 17th Ave Unit 364
- 1382 E 17th Ave
- 1356 E 17th Ave Unit 358
- 1386 E 17th Ave
- 1354 E 17th Ave
- 1381 E 18th Ave
- 1385 E 18th Ave
- 1373 E 18th Ave Unit 375
- 1350 E 17th Ave
- 1389 E 18th Ave
- 1369 E 18th Ave Unit 371
- 1369-1371 E 18th Ave Unit 371
- 1369 E 18th Ave Unit 71
- 1367 E 17th Ave
- 1373 E 17th Ave
Your Personal Tour Guide
Ask me questions while you tour the home.