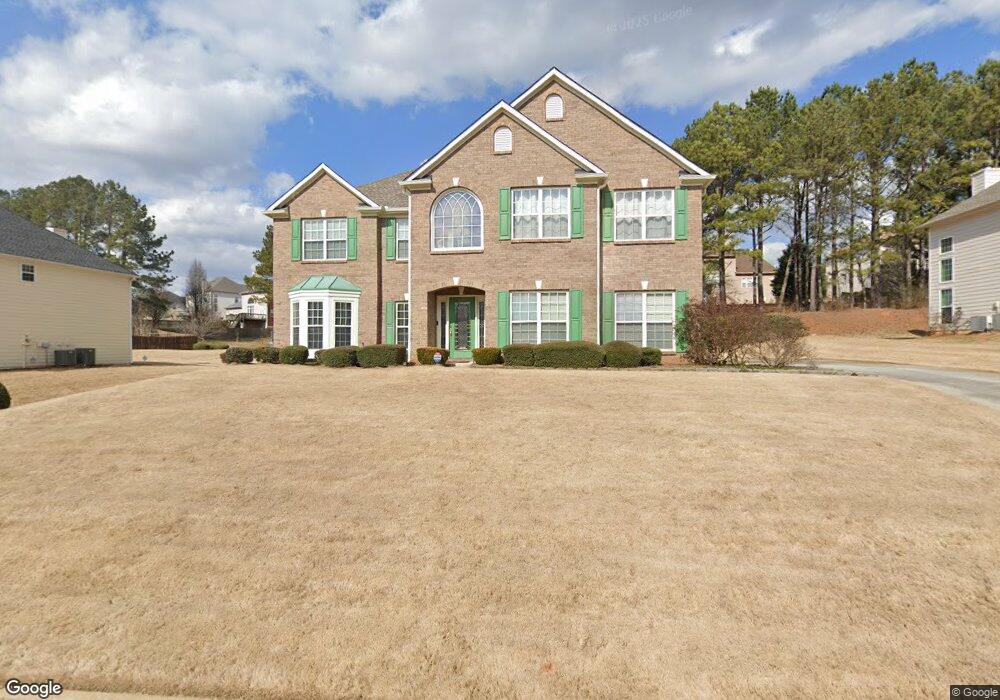
1370 Fall River Dr Conyers, GA 30013
Estimated Value: $384,000 - $451,000
5
Beds
3
Baths
2,911
Sq Ft
$143/Sq Ft
Est. Value
About This Home
This home is located at 1370 Fall River Dr, Conyers, GA 30013 and is currently estimated at $417,342, approximately $143 per square foot. 1370 Fall River Dr is a home located in Rockdale County with nearby schools including Honey Creek Elementary School, Memorial Middle School, and Salem High School.
Ownership History
Date
Name
Owned For
Owner Type
Purchase Details
Closed on
Dec 22, 2008
Sold by
Deutsche Bank 2007-Oa1
Bought by
Thomas Ronald
Current Estimated Value
Home Financials for this Owner
Home Financials are based on the most recent Mortgage that was taken out on this home.
Original Mortgage
$178,342
Outstanding Balance
$113,736
Interest Rate
5.43%
Mortgage Type
FHA
Estimated Equity
$303,606
Purchase Details
Closed on
Sep 2, 2008
Sold by
White Glenda Y
Bought by
Deutsche Bank Gsr 2007-Oa1
Purchase Details
Closed on
Sep 23, 2005
Sold by
The Ryland Grp Inc
Bought by
White Glenda Y
Home Financials for this Owner
Home Financials are based on the most recent Mortgage that was taken out on this home.
Original Mortgage
$50,035
Interest Rate
5.72%
Mortgage Type
Stand Alone Refi Refinance Of Original Loan
Purchase Details
Closed on
May 25, 2005
Sold by
Five Star Props Gp
Bought by
The Ryland Grp Inc
Create a Home Valuation Report for This Property
The Home Valuation Report is an in-depth analysis detailing your home's value as well as a comparison with similar homes in the area
Home Values in the Area
Average Home Value in this Area
Purchase History
| Date | Buyer | Sale Price | Title Company |
|---|---|---|---|
| Thomas Ronald | $184,500 | -- | |
| Deutsche Bank Gsr 2007-Oa1 | $170,955 | -- | |
| White Glenda Y | $250,200 | -- | |
| The Ryland Grp Inc | $165,800 | -- |
Source: Public Records
Mortgage History
| Date | Status | Borrower | Loan Amount |
|---|---|---|---|
| Open | Thomas Ronald | $178,342 | |
| Previous Owner | White Glenda Y | $50,035 |
Source: Public Records
Tax History Compared to Growth
Tax History
| Year | Tax Paid | Tax Assessment Tax Assessment Total Assessment is a certain percentage of the fair market value that is determined by local assessors to be the total taxable value of land and additions on the property. | Land | Improvement |
|---|---|---|---|---|
| 2024 | $3,240 | $157,440 | $32,520 | $124,920 |
| 2023 | $3,196 | $162,120 | $36,080 | $126,040 |
| 2022 | $3,020 | $143,000 | $31,880 | $111,120 |
| 2021 | $2,269 | $108,120 | $23,800 | $84,320 |
| 2020 | $2,264 | $105,520 | $21,200 | $84,320 |
| 2019 | $1,598 | $81,720 | $13,360 | $68,360 |
| 2018 | $1,607 | $81,720 | $13,360 | $68,360 |
| 2017 | $1,690 | $83,720 | $13,360 | $70,360 |
| 2016 | $1,523 | $83,720 | $13,360 | $70,360 |
| 2015 | $1,695 | $72,040 | $12,240 | $59,800 |
| 2014 | $1,628 | $76,320 | $12,960 | $63,360 |
| 2013 | -- | $85,720 | $19,000 | $66,720 |
Source: Public Records
Map
Nearby Homes
- 1388 Fall River Dr
- 1613 Brolington Ct
- 2513 Riverton Dr
- 464 Reflection Creek Dr
- 440 Reflection Creek Dr
- 452 Reflection Creek Dr
- 1115 Fountain Crest Dr
- 3106 Brians Creek Dr SE
- 3180 Highway 20 SE
- 2405 Brisbane Dr
- 2304 Northglenn Ct
- 3113 Brians Creek Dr SE
- 2585 Westchester Way SE
- 1270 Peeks Ford Rd SE
- 2052 Evergreen Dr SE
- 3205 Haleys Way SE
- 2638 Westchester Pkwy SE
- 1368 Fall River Dr Unit 160
- 1368 Fall River Dr Unit 603
- 1372 Fall River Dr Unit 1
- 1146 Fountain Crest Dr
- 1148 Fountain Crest Dr Unit 1
- 1366 Fall River Dr
- 1366 Fall River Dr Unit 161
- 1374 Fall River Dr Unit 1
- 1144 Fountain Crest Dr Unit 1
- 1369 Fall River Dr Unit 1
- 1371 Fall River Dr Unit 1
- 1150 Fountain Crest Dr
- 1366 Fall River Dr SE
- 1366 Fall River Dr SE Unit 161
- 1367 Fall River Dr
- 1364 Fall River Dr Unit 1
- 1376 Fall River Dr
- 1142 Fountain Crest Dr Unit 1
- 1152 Fountain Crest Dr Unit 1
- 1365 Fall River Dr