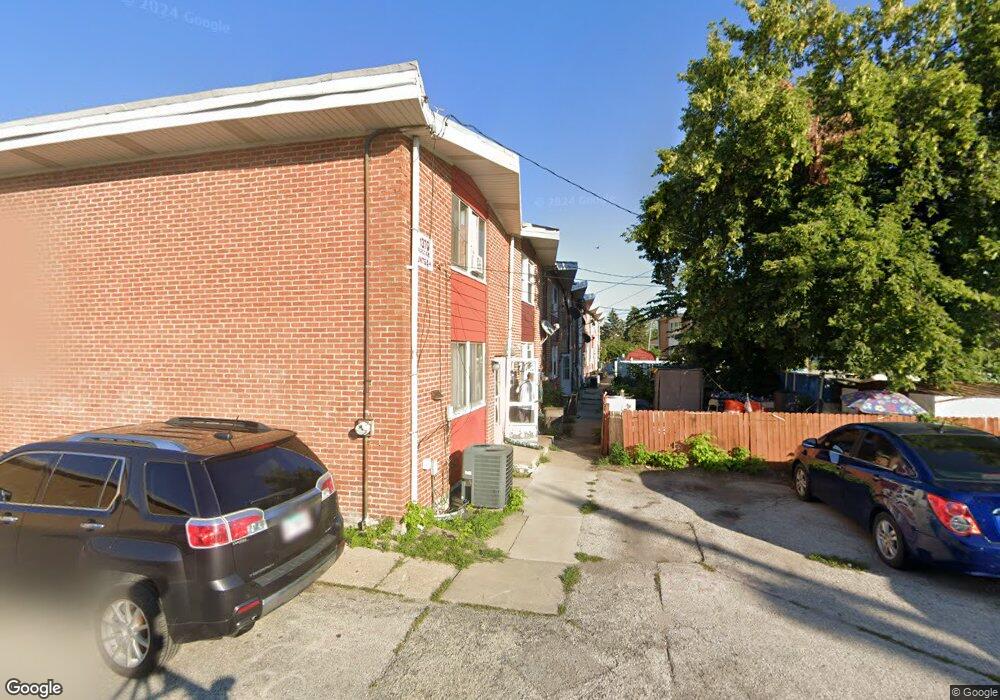
1370 Fargo Ave Des Plaines, IL 60018
Estimated Value: $239,000 - $254,758
3
Beds
2
Baths
1,152
Sq Ft
$217/Sq Ft
Est. Value
About This Home
This home is located at 1370 Fargo Ave, Des Plaines, IL 60018 and is currently estimated at $249,690, approximately $216 per square foot. 1370 Fargo Ave is a home located in Cook County with nearby schools including Plainfield Elementary School, Algonquin Middle School, and Maine West High School.
Ownership History
Date
Name
Owned For
Owner Type
Purchase Details
Closed on
Jul 20, 2012
Sold by
Espinoza Miguel
Bought by
Espinoza Miguel and Espinoza Maria J
Current Estimated Value
Purchase Details
Closed on
Feb 20, 2004
Sold by
Ruiz Miguel Espinosa and Espinosa Maria
Bought by
Espinosa Miguel
Home Financials for this Owner
Home Financials are based on the most recent Mortgage that was taken out on this home.
Original Mortgage
$84,000
Interest Rate
5.91%
Mortgage Type
New Conventional
Purchase Details
Closed on
Mar 16, 2001
Sold by
Ruiz Miguel Espinosa and Espinosa Ramon
Bought by
Ruiz Miguel Espinosa and Espinosa Maria
Home Financials for this Owner
Home Financials are based on the most recent Mortgage that was taken out on this home.
Original Mortgage
$87,325
Interest Rate
7.02%
Mortgage Type
FHA
Create a Home Valuation Report for This Property
The Home Valuation Report is an in-depth analysis detailing your home's value as well as a comparison with similar homes in the area
Home Values in the Area
Average Home Value in this Area
Purchase History
| Date | Buyer | Sale Price | Title Company |
|---|---|---|---|
| Espinoza Miguel | -- | Multiple | |
| Espinosa Miguel | -- | Multiple | |
| Ruiz Miguel Espinosa | -- | -- |
Source: Public Records
Mortgage History
| Date | Status | Borrower | Loan Amount |
|---|---|---|---|
| Closed | Espinosa Miguel | $84,000 | |
| Closed | Ruiz Miguel Espinosa | $87,325 |
Source: Public Records
Tax History Compared to Growth
Tax History
| Year | Tax Paid | Tax Assessment Tax Assessment Total Assessment is a certain percentage of the fair market value that is determined by local assessors to be the total taxable value of land and additions on the property. | Land | Improvement |
|---|---|---|---|---|
| 2024 | $1,473 | $19,000 | $3,000 | $16,000 |
| 2023 | $1,483 | $19,000 | $3,000 | $16,000 |
| 2022 | $1,483 | $19,000 | $3,000 | $16,000 |
| 2021 | $1,725 | $12,630 | $1,615 | $11,015 |
| 2020 | $1,580 | $12,630 | $1,615 | $11,015 |
| 2019 | $1,555 | $14,192 | $1,615 | $12,577 |
| 2018 | $1,731 | $13,139 | $1,425 | $11,714 |
| 2017 | $1,671 | $13,139 | $1,425 | $11,714 |
| 2016 | $2,265 | $13,139 | $1,425 | $11,714 |
| 2015 | $2,589 | $13,091 | $1,235 | $11,856 |
| 2014 | $2,481 | $13,091 | $1,235 | $11,856 |
| 2013 | $1,935 | $13,091 | $1,235 | $11,856 |
Source: Public Records
Map
Nearby Homes
- 2131 Ash St Unit G
- 2061 Pine St Unit C
- 2017 Pine St Unit B
- 2055 Lee St
- 1857 Pine St
- 1629 E Touhy Ave
- 1641 E Touhy Ave
- 1624 Estes Ave
- 1783 Lee St
- 1847 Dexter Ln
- 1776 Stockton Ave
- 2025 Plainfield Dr
- 1765 Prospect Ave
- 1895 Welwyn Ave
- 1668 S Cora St
- 2054 Birch St
- 1721 Linden St
- 2209 Douglas Ave
- 2358 Westview Dr
- 2646 Maple St
- 1370 Fargo Ave Unit H
- 1370 Fargo Ave
- 1370 Fargo Ave
- 1370 Fargo Ave
- 1370 Fargo Ave
- 1370 Fargo Ave
- 1370 Fargo Ave
- 1370 Fargo Ave
- 1370 Fargo Ave Unit D
- 1370 Fargo Ave Unit C
- 1370 Fargo Ave Unit C
- 1370 Fargo Ave Unit E
- 1372 Fargo Ave
- 1372 Fargo Ave
- 1372 Fargo Ave
- 1372 Fargo Ave
- 1372 Fargo Ave
- 1372 Fargo Ave
- 1372 Fargo Ave
- 1372 Fargo Ave