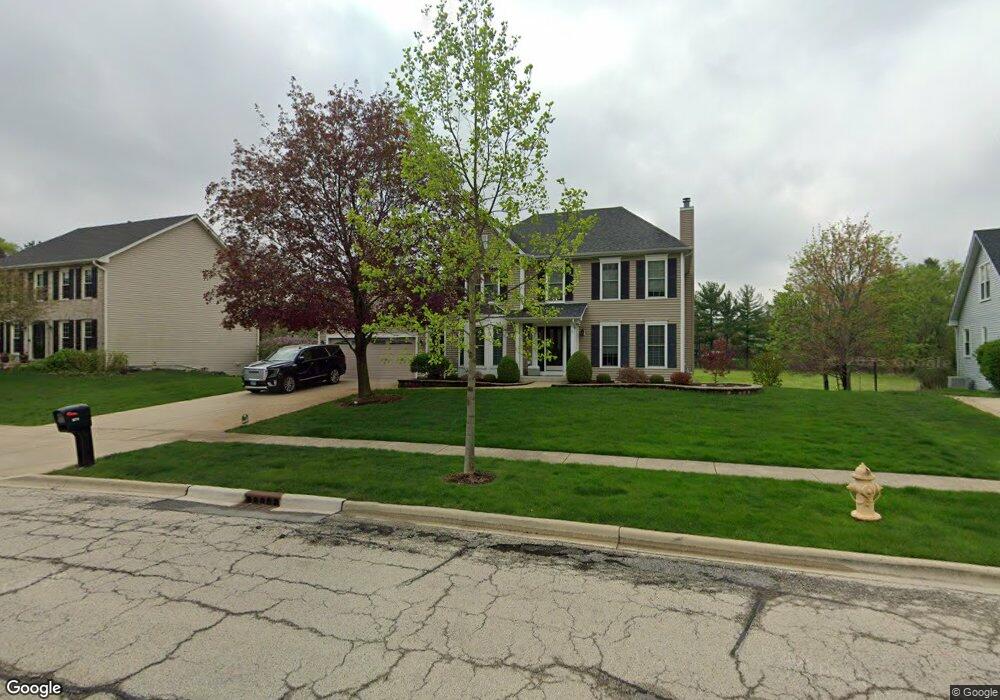
1370 Nagel Ct West Chicago, IL 60185
Chicago West NeighborhoodEstimated Value: $496,219 - $561,000
4
Beds
3
Baths
2,108
Sq Ft
$251/Sq Ft
Est. Value
About This Home
This home is located at 1370 Nagel Ct, West Chicago, IL 60185 and is currently estimated at $528,555, approximately $250 per square foot. 1370 Nagel Ct is a home located in DuPage County with nearby schools including Wegner Elementary School, Leman Middle School, and West Chicago Community High School.
Ownership History
Date
Name
Owned For
Owner Type
Purchase Details
Closed on
Sep 25, 2024
Sold by
Cook Christopher A and Cook Carol Lynn
Bought by
Christopher And Carol Cook Living Trust and Cook
Current Estimated Value
Purchase Details
Closed on
Aug 14, 1998
Sold by
Binetti Frank and Binetti Dorothy
Bought by
Cook Christopher A and Cook Carol Lynn
Home Financials for this Owner
Home Financials are based on the most recent Mortgage that was taken out on this home.
Original Mortgage
$187,200
Interest Rate
7.03%
Purchase Details
Closed on
Sep 27, 1996
Sold by
Windham Deerpoint Joint Venture Iii
Bought by
Binetti Frank and Binetti Dorothy
Home Financials for this Owner
Home Financials are based on the most recent Mortgage that was taken out on this home.
Original Mortgage
$200,000
Interest Rate
7.87%
Create a Home Valuation Report for This Property
The Home Valuation Report is an in-depth analysis detailing your home's value as well as a comparison with similar homes in the area
Home Values in the Area
Average Home Value in this Area
Purchase History
| Date | Buyer | Sale Price | Title Company |
|---|---|---|---|
| Christopher And Carol Cook Living Trust | -- | None Listed On Document | |
| Christopher And Carol Cook Living Trust | -- | None Listed On Document | |
| Cook Christopher A | $234,000 | -- | |
| Binetti Frank | $234,000 | -- |
Source: Public Records
Mortgage History
| Date | Status | Borrower | Loan Amount |
|---|---|---|---|
| Previous Owner | Cook Christopher A | $187,200 | |
| Previous Owner | Binetti Frank | $200,000 | |
| Closed | Cook Christopher A | $23,400 |
Source: Public Records
Tax History Compared to Growth
Tax History
| Year | Tax Paid | Tax Assessment Tax Assessment Total Assessment is a certain percentage of the fair market value that is determined by local assessors to be the total taxable value of land and additions on the property. | Land | Improvement |
|---|---|---|---|---|
| 2024 | $11,514 | $138,337 | $50,051 | $88,286 |
| 2023 | $10,838 | $125,510 | $45,410 | $80,100 |
| 2022 | $9,884 | $111,080 | $40,190 | $70,890 |
| 2021 | $9,459 | $105,450 | $38,150 | $67,300 |
| 2020 | $9,244 | $102,290 | $37,010 | $65,280 |
| 2019 | $9,092 | $98,640 | $35,690 | $62,950 |
| 2018 | $9,795 | $103,730 | $37,530 | $66,200 |
| 2017 | $9,655 | $99,590 | $36,030 | $63,560 |
| 2016 | $9,633 | $95,130 | $34,420 | $60,710 |
| 2015 | $9,669 | $90,050 | $32,580 | $57,470 |
| 2014 | $9,477 | $87,760 | $31,750 | $56,010 |
| 2013 | $9,471 | $89,860 | $32,510 | $57,350 |
Source: Public Records
Map
Nearby Homes
- 1405 Prairie Crossing Dr
- 1066 Trillium Trail
- 29W548 Cape Ave
- 440 Cranesbill Dr
- 3N050 Timberline Dr
- 1137 Lillian Ln Unit 130
- 31W780 North Ave
- 3N234 Cuyahoga Terrace
- 226 Risch Ct
- 963 Lakeside Dr
- 840 Arbor Ave
- NEC Pine Ave
- 867 Honeysuckle Ave
- 29W214 Lee Rd
- 651 Nor Oaks Ct
- 4 VACANT LOTS James Ave
- 1110 Natalie Dr
- 1N485 N Neltnor Blvd
- 360 Long Oak Dr
- 3N011 Morningside Ave
- 1380 Nagel Ct
- 1360 Nagel Ct
- 1350 Nagel Ct
- 1359 Nagel Ct
- 1395 Nagel Ct
- 1345 Nagel Ct
- 1340 Nagel Ct
- 1410 Prairie Crossing Dr
- 1335 Nagel Ct
- 1405 Nagel Ct
- 1420 Prairie Crossing Dr
- 1386 Prairie Ct
- 1330 Nagel Ct
- 1378 Prairie Ct
- 1325 Nagel Ct
- 1372 Prairie Ct
- 1401 Prairie Ct
- 1320 Nagel Ct
- 1366 Prairie Ct
- 2N515 Woodcrest Dr