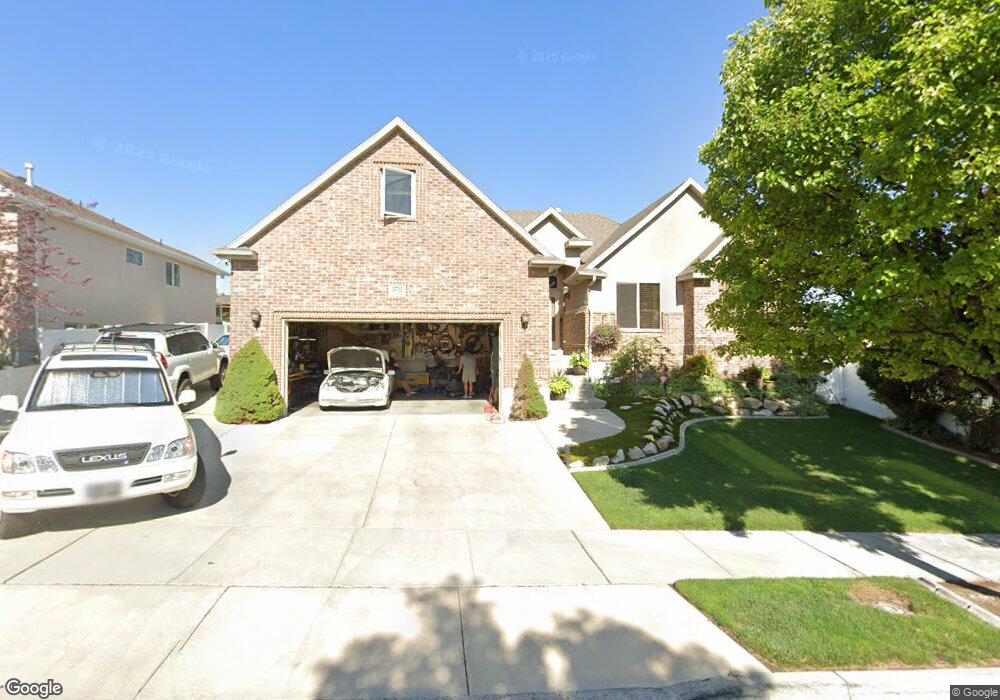
13702 Crimson Patch Way Riverton, UT 84096
Estimated Value: $612,394 - $742,000
3
Beds
2
Baths
2,055
Sq Ft
$329/Sq Ft
Est. Value
About This Home
This home is located at 13702 Crimson Patch Way, Riverton, UT 84096 and is currently estimated at $676,849, approximately $329 per square foot. 13702 Crimson Patch Way is a home located in Salt Lake County with nearby schools including Foothills School, South Hills Middle School, and Mountain Ridge High School.
Ownership History
Date
Name
Owned For
Owner Type
Purchase Details
Closed on
Mar 18, 2005
Sold by
Wright & Associates Lc
Bought by
Mullaly Owen D and Mullaly Teasha A
Current Estimated Value
Home Financials for this Owner
Home Financials are based on the most recent Mortgage that was taken out on this home.
Original Mortgage
$23,350
Outstanding Balance
$11,838
Interest Rate
5.61%
Mortgage Type
Credit Line Revolving
Estimated Equity
$665,011
Purchase Details
Closed on
Oct 5, 2004
Sold by
Monarch Properties Llc
Bought by
Wright & Associates Lc
Home Financials for this Owner
Home Financials are based on the most recent Mortgage that was taken out on this home.
Original Mortgage
$4,500,000
Interest Rate
5.77%
Mortgage Type
Purchase Money Mortgage
Create a Home Valuation Report for This Property
The Home Valuation Report is an in-depth analysis detailing your home's value as well as a comparison with similar homes in the area
Home Values in the Area
Average Home Value in this Area
Purchase History
| Date | Buyer | Sale Price | Title Company |
|---|---|---|---|
| Mullaly Owen D | -- | Integrated Title Ins Svcs | |
| Wright & Associates Lc | -- | Integrated Title Ins Svcs |
Source: Public Records
Mortgage History
| Date | Status | Borrower | Loan Amount |
|---|---|---|---|
| Open | Mullaly Owen D | $23,350 | |
| Open | Mullaly Owen D | $186,900 | |
| Previous Owner | Wright & Associates Lc | $4,500,000 |
Source: Public Records
Tax History
| Year | Tax Paid | Tax Assessment Tax Assessment Total Assessment is a certain percentage of the fair market value that is determined by local assessors to be the total taxable value of land and additions on the property. | Land | Improvement |
|---|---|---|---|---|
| 2025 | $3,487 | $632,100 | $150,200 | $481,900 |
| 2024 | $3,487 | $603,500 | $145,100 | $458,400 |
| 2023 | $3,438 | $560,900 | $127,200 | $433,700 |
| 2022 | $3,590 | $574,700 | $124,700 | $450,000 |
| 2021 | $135 | $440,600 | $96,100 | $344,500 |
| 2020 | $2,907 | $386,200 | $96,100 | $290,100 |
| 2019 | $2,872 | $375,100 | $96,100 | $279,000 |
| 2016 | $2,626 | $315,800 | $89,600 | $226,200 |
Source: Public Records
Map
Nearby Homes
- 13578 S Buckeye View Way
- 5157 Gossamer Way
- 13626 S Bluewing Way
- 5612 W High Spirit Ct
- 5244 W Shaggy Peak Dr
- 6652 13400 S
- 13397 S Alto Vista Ln
- 13597 S Firetip Ct
- 13392 S Alto Vista Ln
- 13377 S Vitasol Ln
- 5633 Bonica Ln
- 13343 S Fallowfield Ln
- 13830 S Little Water Peak Dr
- 13844 S Belle Isis Bay
- 13324 S Ashurst Ln
- 13503 S Leaf Wing Ln
- 13941 S 4960 W
- 5371 W Rochdale Ln
- 4869 W Anise St
- 13534 S Skipperling Ln
- 13712 S Crimson Patch Way
- 13712 Crimson Patch Way
- 13724 S Crimson Patch Way
- 13724 Crimson Patch Way
- 13707 Crimson Patch Way
- 13707 S Crimson Patch Way
- 13719 Crimson Patch Way
- 13719 S Crimson Patch Way
- 13729 Crimson Patch Way
- 13682 S Crimson Patch Way
- 13682 Crimson Patch Way
- 13734 S Crimson Patch Way
- 13734 Crimson Patch Way
- 13683 Crimson Patch Way
- 13708 S Buckeye View Way
- 13718 S Buckeye View Way
- 13739 Crimson Patch Way
- 13728 S Buckeye View Way
- 13686 S Buckeye View Way
- 13672 Crimson Patch Way
Your Personal Tour Guide
Ask me questions while you tour the home.