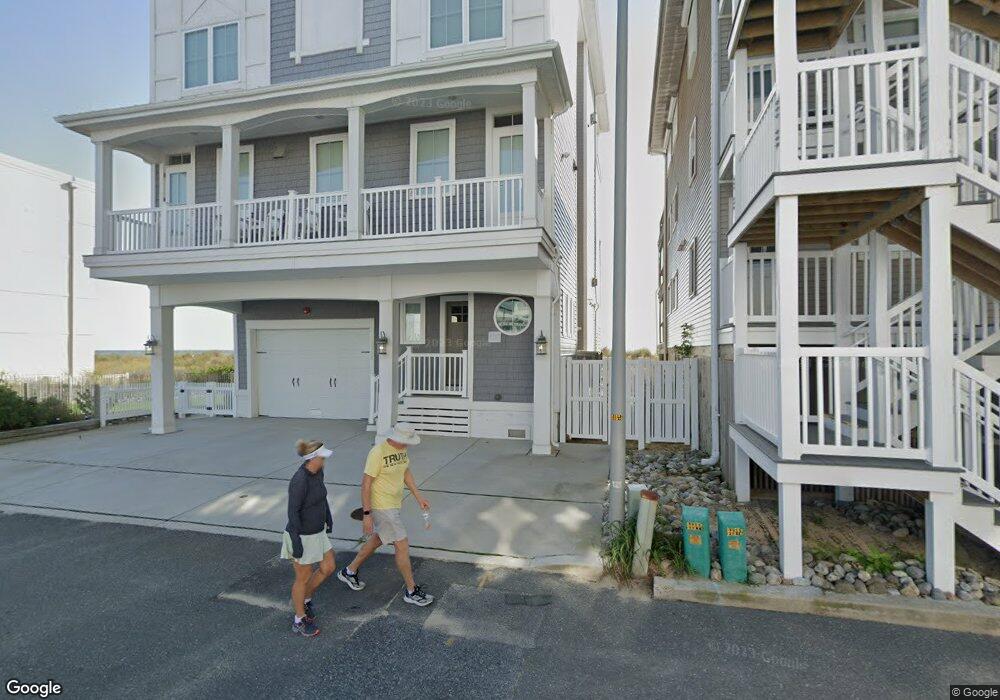
13706 Wight St Unit B Ocean City, MD 21842
Estimated Value: $1,430,000 - $3,194,150
4
Beds
3
Baths
1,953
Sq Ft
$1,184/Sq Ft
Est. Value
About This Home
This home is located at 13706 Wight St Unit B, Ocean City, MD 21842 and is currently estimated at $2,312,075, approximately $1,183 per square foot. 13706 Wight St Unit B is a home located in Worcester County with nearby schools including Ocean City Elementary School, Stephen Decatur Middle School, and Berlin Intermediate School.
Ownership History
Date
Name
Owned For
Owner Type
Purchase Details
Closed on
Nov 22, 2016
Sold by
Mewquist Family Limited Partnership
Bought by
Newquist Eric A and Newquist Dawn A
Current Estimated Value
Home Financials for this Owner
Home Financials are based on the most recent Mortgage that was taken out on this home.
Original Mortgage
$1,995,632
Outstanding Balance
$1,623,260
Interest Rate
3.47%
Mortgage Type
New Conventional
Estimated Equity
$688,815
Purchase Details
Closed on
Aug 22, 2014
Sold by
Summers Dawn Llc
Bought by
Newquist Family Limited Partnership
Purchase Details
Closed on
Apr 26, 2004
Sold by
J. Vassos Nicholas and J. K. Elaine
Bought by
Summers Dawn Llc
Purchase Details
Closed on
Feb 14, 2003
Sold by
Bair Susan G R and Bair Albert
Bought by
Vassos Nicholas J
Purchase Details
Closed on
Jun 12, 2002
Sold by
Vassos Nicholas J and Vassos Elaine K
Bought by
Vassos Nicholas J and Vassos Elaine K
Create a Home Valuation Report for This Property
The Home Valuation Report is an in-depth analysis detailing your home's value as well as a comparison with similar homes in the area
Home Values in the Area
Average Home Value in this Area
Purchase History
| Date | Buyer | Sale Price | Title Company |
|---|---|---|---|
| Newquist Eric A | $1,000,000 | None Available | |
| Newquist Family Limited Partnership | -- | None Available | |
| Summers Dawn Llc | $1,450,000 | -- | |
| Vassos Nicholas J | $825,000 | -- | |
| Vassos Nicholas J | -- | -- |
Source: Public Records
Mortgage History
| Date | Status | Borrower | Loan Amount |
|---|---|---|---|
| Open | Newquist Eric A | $1,995,632 | |
| Closed | Vassos Nicholas J | -- |
Source: Public Records
Tax History Compared to Growth
Tax History
| Year | Tax Paid | Tax Assessment Tax Assessment Total Assessment is a certain percentage of the fair market value that is determined by local assessors to be the total taxable value of land and additions on the property. | Land | Improvement |
|---|---|---|---|---|
| 2025 | $30,943 | $2,266,033 | $0 | $0 |
| 2024 | $30,437 | $2,181,267 | $0 | $0 |
| 2023 | $29,464 | $2,096,500 | $1,243,100 | $853,400 |
| 2022 | $29,285 | $2,083,767 | $0 | $0 |
| 2021 | $29,266 | $2,071,033 | $0 | $0 |
| 2020 | $29,082 | $2,058,300 | $1,243,100 | $815,200 |
| 2019 | $29,281 | $2,058,300 | $1,243,100 | $815,200 |
| 2018 | $28,990 | $2,058,300 | $1,243,100 | $815,200 |
| 2017 | $8,122 | $575,000 | $0 | $0 |
| 2016 | -- | $780,000 | $0 | $0 |
| 2015 | $9,667 | $780,000 | $0 | $0 |
| 2014 | $9,667 | $849,800 | $0 | $0 |
Source: Public Records
Map
Nearby Homes
- 16 138th St Unit 106
- 5 139th St Unit 302
- 9 138th St Unit 307
- 2 137th St Unit 103
- 13908 Wight St Unit 207
- 17 139th St Unit 101
- 6 137th St Unit 304
- 13700 Coastal Hwy Unit 302
- 14 136th St Unit 205
- 13901 Coastal Hwy Unit 5A
- 14000 Coastal Hwy Unit 403
- 14000 Coastal Hwy Unit 303
- 7 136th St Unit N405
- 14001 Coastal Hwy Unit 109
- 13500 Coastal Hwy Unit 201
- 13500 Coastal Hwy Unit 403
- 13500 Coastal Hwy Unit 104
- 13400 Coastal Hwy
- 13400 Coastal Hwy Unit N303
- 13400 Coastal Hwy
- 13706 Wight St
- 13706A Wight St
- 13706B Wight St
- 13704 Wight St Unit 14
- 13704 Wight St Unit 12
- 13704 Wight St Unit 18
- 13704 Wight St Unit 10
- 13704 Wight St Unit 6
- 13704 Wight St Unit 17
- 13704 Wight St Unit 15
- 13704 Wight St Unit 16
- 13704 Wight St Unit 8
- 13704 Wight St Unit 9
- 13704 Wight St Unit 1
- 13704 Wight St Unit 13
- 13704 Wight St Unit 11
- 13704 Wight St Unit 7
- 13704 Wight St Unit 5
- 13704 Wight St Unit 3
- 13704 Wight St Unit 2