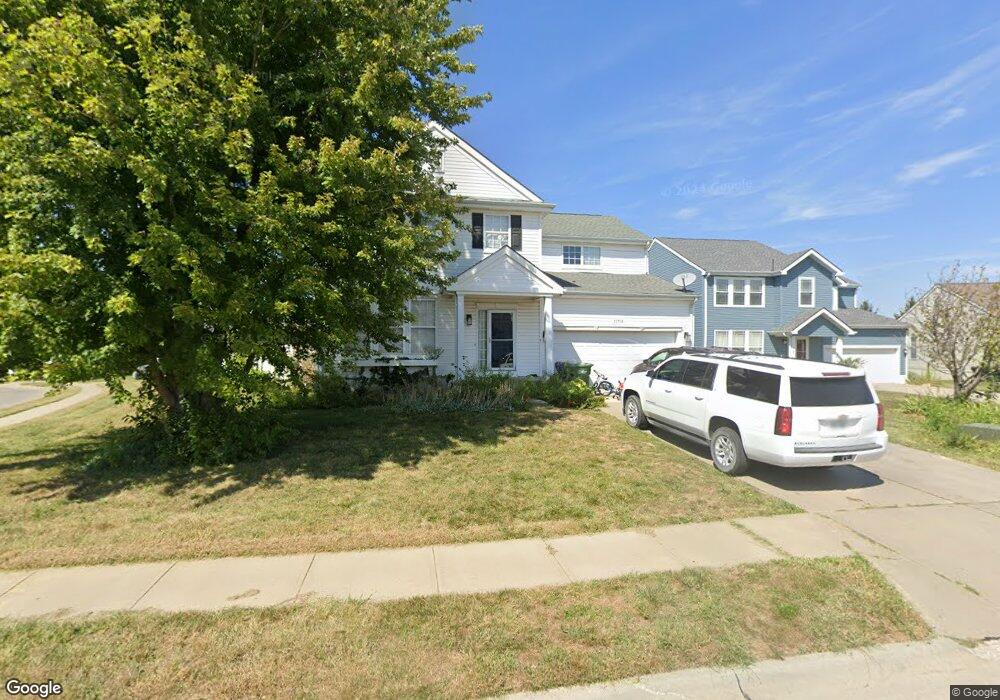
13708 S 28th Cir Bellevue, NE 68123
Estimated Value: $354,000 - $406,000
4
Beds
4
Baths
2,780
Sq Ft
$136/Sq Ft
Est. Value
About This Home
This home is located at 13708 S 28th Cir, Bellevue, NE 68123 and is currently estimated at $379,378, approximately $136 per square foot. 13708 S 28th Cir is a home located in Sarpy County with nearby schools including Two Springs Elementary School, Lewis & Clark Middle School, and Bellevue East High School.
Ownership History
Date
Name
Owned For
Owner Type
Purchase Details
Closed on
Jun 20, 2011
Sold by
Burns Brian J and Burns Tammy L
Bought by
Kurpgeweit Stephanie O
Current Estimated Value
Home Financials for this Owner
Home Financials are based on the most recent Mortgage that was taken out on this home.
Original Mortgage
$196,879
Outstanding Balance
$131,281
Interest Rate
4.25%
Mortgage Type
FHA
Estimated Equity
$248,097
Purchase Details
Closed on
Apr 13, 2007
Sold by
Hardy Cedric M and Armstrong Hardy Sheri L
Bought by
Burns Brian J and Burns Tammy L
Home Financials for this Owner
Home Financials are based on the most recent Mortgage that was taken out on this home.
Original Mortgage
$159,200
Interest Rate
6.1%
Purchase Details
Closed on
Mar 29, 2005
Sold by
Lingham Daniel A and Lingham Kim E
Bought by
Hardy Cedric M and Armstrong Hardy Sheri L
Home Financials for this Owner
Home Financials are based on the most recent Mortgage that was taken out on this home.
Original Mortgage
$197,000
Interest Rate
5.75%
Purchase Details
Closed on
Aug 14, 2002
Sold by
Hearthstone Homes Inc
Bought by
Lingham Daniel A and Lingham Kim E
Create a Home Valuation Report for This Property
The Home Valuation Report is an in-depth analysis detailing your home's value as well as a comparison with similar homes in the area
Home Values in the Area
Average Home Value in this Area
Purchase History
| Date | Buyer | Sale Price | Title Company |
|---|---|---|---|
| Kurpgeweit Stephanie O | $203,000 | Omaha Title & Escrow Inc | |
| Burns Brian J | $199,000 | Prestige Title & Escrow | |
| Hardy Cedric M | $197,000 | -- | |
| Lingham Daniel A | $179,000 | -- |
Source: Public Records
Mortgage History
| Date | Status | Borrower | Loan Amount |
|---|---|---|---|
| Open | Kurpgeweit Stephanie O | $196,879 | |
| Previous Owner | Burns Brian J | $159,200 | |
| Previous Owner | Hardy Cedric M | $197,000 |
Source: Public Records
Tax History
| Year | Tax Paid | Tax Assessment Tax Assessment Total Assessment is a certain percentage of the fair market value that is determined by local assessors to be the total taxable value of land and additions on the property. | Land | Improvement |
|---|---|---|---|---|
| 2025 | $5,661 | $345,720 | $48,000 | $297,720 |
| 2024 | $6,536 | $326,177 | $48,000 | $278,177 |
| 2023 | $6,536 | $309,547 | $44,000 | $265,547 |
| 2022 | $5,834 | $271,090 | $40,000 | $231,090 |
| 2021 | $5,518 | $253,682 | $34,000 | $219,682 |
| 2020 | $5,239 | $240,108 | $34,000 | $206,108 |
| 2019 | $5,233 | $230,025 | $34,000 | $196,025 |
| 2018 | $5,021 | $224,393 | $30,000 | $194,393 |
| 2017 | $4,833 | $210,500 | $30,000 | $180,500 |
| 2016 | $4,555 | $201,420 | $28,000 | $173,420 |
| 2015 | $4,477 | $201,960 | $28,000 | $173,960 |
| 2014 | $4,329 | $194,130 | $28,000 | $166,130 |
| 2012 | -- | $191,304 | $27,000 | $164,304 |
Source: Public Records
Map
Nearby Homes
- 2924 Blackhawk Cir
- 3004 Lone Tree Rd
- 13910 Kelly Dr
- 3110 Jason Cir
- 14109 Tregaron Ridge Ave Unit E
- 2711 Lynnwood Dr
- 14206 S 30th Ave
- 2504 Century Rd
- 2303 Coventry Dr
- 2917 Daniell Cir
- 13007 S 29th Ave
- 14106 S 21st St
- 14104 S 33rd Ave
- 3106 Lynnwood Dr
- 12901 S 29th Place
- 2108 Plymouth Rock Rd
- 13911 S 36th St
- 14309 S 34th St
- 3501 Lynnwood Dr
- 14313 S 20th St
- 13706 S 28th Cir
- 2904 Kelly Dr
- 2903 Kelly Dr
- 13704 S 28th Cir
- 2906 Kelly Dr
- 2903 Arrowhead Ln
- 2901 Arrowhead Ln
- 13708 Kelly Dr
- 2905 Kelly Dr
- 13709 S 28th Cir
- 2905 Arrowhead Ln
- 2811 Arrowhead Ln
- 2908 Kelly Dr
- 2908 Kelly Dr
- 2907 Kelly Dr
- 2907 Arrowhead Ln
- 13707 S 28th Cir
- 2809 Arrowhead Ln
- 13702 S 28th Cir
- 13705 S 28th Cir
Your Personal Tour Guide
Ask me questions while you tour the home.