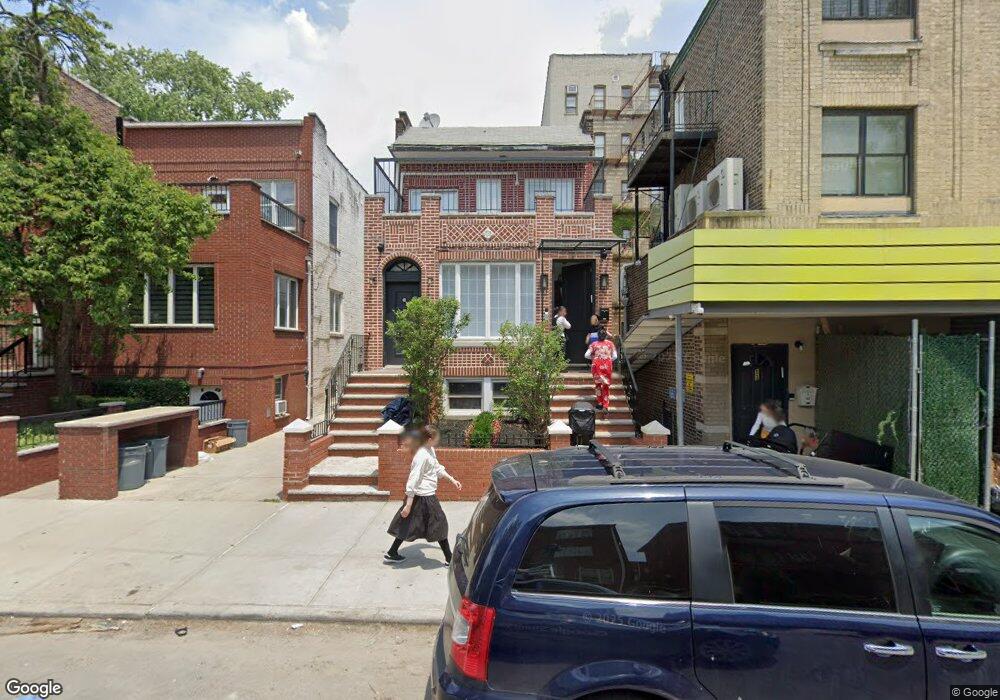
1371 56th St Brooklyn, NY 11219
Borough Park NeighborhoodEstimated Value: $1,864,000 - $3,085,000
Studio
--
Bath
3,720
Sq Ft
$635/Sq Ft
Est. Value
About This Home
This home is located at 1371 56th St, Brooklyn, NY 11219 and is currently estimated at $2,361,564, approximately $634 per square foot. 1371 56th St is a home located in Kings County with nearby schools including The Seeall Academy, Junior High School 227 Edward B Shallow, and Franklin Delano Roosevelt High School.
Ownership History
Date
Name
Owned For
Owner Type
Purchase Details
Closed on
Aug 11, 2021
Sold by
Hertanu As Trustee Brenda and Hertanu
Bought by
Schwartz Jacob
Current Estimated Value
Home Financials for this Owner
Home Financials are based on the most recent Mortgage that was taken out on this home.
Original Mortgage
$1,468,800
Outstanding Balance
$1,329,815
Interest Rate
2.9%
Mortgage Type
Purchase Money Mortgage
Estimated Equity
$1,031,749
Purchase Details
Closed on
Jul 2, 2003
Sold by
Hertanu Brenda and Senderovic Morris
Bought by
Hertanu Brenda and Hertanu Joseph
Home Financials for this Owner
Home Financials are based on the most recent Mortgage that was taken out on this home.
Original Mortgage
$413,000
Interest Rate
6.22%
Mortgage Type
Purchase Money Mortgage
Purchase Details
Closed on
Oct 31, 1996
Sold by
Senderovic Sara
Bought by
Sara Senderovic Trust
Create a Home Valuation Report for This Property
The Home Valuation Report is an in-depth analysis detailing your home's value as well as a comparison with similar homes in the area
Home Values in the Area
Average Home Value in this Area
Purchase History
| Date | Buyer | Sale Price | Title Company |
|---|---|---|---|
| Schwartz Jacob | $1,836,000 | -- | |
| Schwartz Jacob | $1,836,000 | -- | |
| Schwartz Jacob | $1,836,000 | -- | |
| Hertanu Brenda | -- | -- | |
| Hertanu Brenda | -- | -- | |
| Hertanu Brenda | -- | -- | |
| Sara Senderovic Trust | $120,000 | -- | |
| Sara Senderovic Trust | $120,000 | -- |
Source: Public Records
Mortgage History
| Date | Status | Borrower | Loan Amount |
|---|---|---|---|
| Open | Schwartz Jacob | $1,468,800 | |
| Closed | Schwartz Jacob | $1,468,800 | |
| Previous Owner | Hertanu Brenda | $413,000 |
Source: Public Records
Tax History
| Year | Tax Paid | Tax Assessment Tax Assessment Total Assessment is a certain percentage of the fair market value that is determined by local assessors to be the total taxable value of land and additions on the property. | Land | Improvement |
|---|---|---|---|---|
| 2025 | $11,572 | $129,780 | $24,480 | $105,300 |
| 2024 | $11,572 | $110,820 | $24,480 | $86,340 |
| 2023 | $11,090 | $118,920 | $24,480 | $94,440 |
| 2022 | $10,300 | $97,320 | $24,480 | $72,840 |
| 2021 | $10,858 | $106,080 | $24,480 | $81,600 |
| 2020 | $5,323 | $138,060 | $24,480 | $113,580 |
| 2019 | $10,044 | $138,060 | $24,480 | $113,580 |
| 2018 | $9,276 | $45,504 | $9,933 | $35,571 |
| 2017 | $8,765 | $42,996 | $14,804 | $28,192 |
| 2016 | $8,595 | $42,996 | $17,369 | $25,627 |
| 2015 | $4,892 | $42,398 | $18,036 | $24,362 |
| 2014 | $4,892 | $40,011 | $14,472 | $25,539 |
Source: Public Records
Map
Nearby Homes
- 5602 New Utrecht Ave
- 5812 New Utrecht Ave
- 5303 13th Ave
- 1241 60th St
- 1348 63rd St Unit 5
- 1363 64th St
- 6311 13th Ave
- 1238 63rd St Unit 438
- 1238 63rd St Unit D342
- 1238 63rd St Unit 428
- 1238 63rd St Unit D336
- 1238 63rd St Unit D326
- 1238 63rd St Unit 247
- 1238 63rd St Unit D-402
- 1238 63rd St Unit D306
- 1238 63rd St Unit 449
- 1270 64th St Unit 2A
- 1270 64th St Unit 1B
- 1270 64th St Unit 3B
- 6426 New Utrecht Ave
Your Personal Tour Guide
Ask me questions while you tour the home.