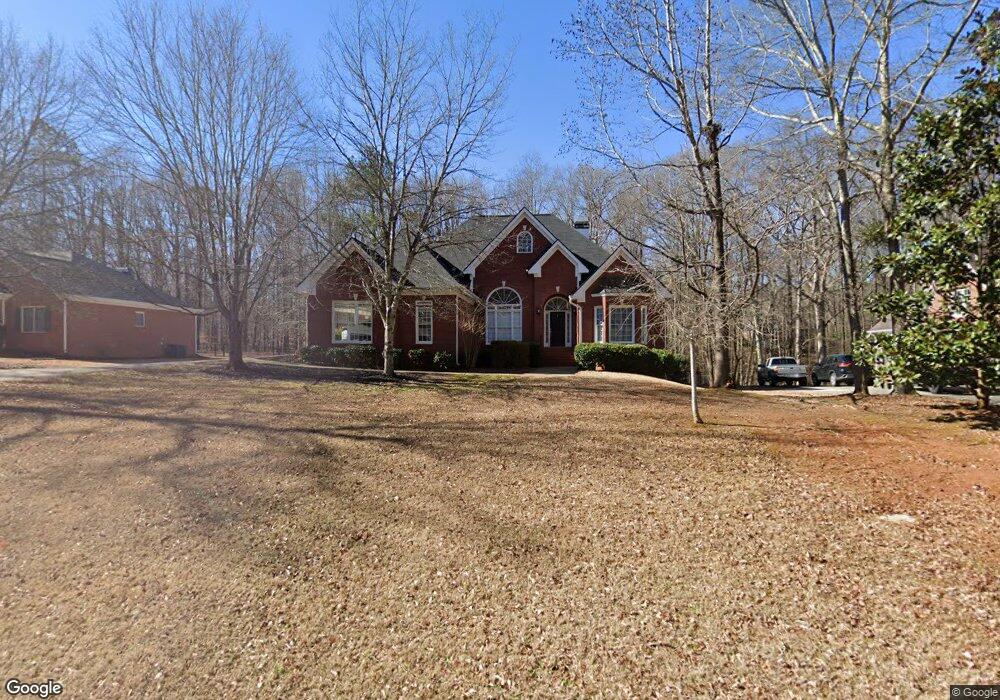
1371 Arizona Bend Bogart, GA 30622
Estimated Value: $664,000 - $770,000
3
Beds
3
Baths
2,400
Sq Ft
$298/Sq Ft
Est. Value
About This Home
This home is located at 1371 Arizona Bend, Bogart, GA 30622 and is currently estimated at $714,490, approximately $297 per square foot. 1371 Arizona Bend is a home located in Oconee County with nearby schools including Malcom Bridge Elementary School, Malcom Bridge Middle School, and North Oconee High School.
Ownership History
Date
Name
Owned For
Owner Type
Purchase Details
Closed on
Apr 27, 2018
Sold by
Mercardante Kathryn
Bought by
Aguar Nathaniel
Current Estimated Value
Home Financials for this Owner
Home Financials are based on the most recent Mortgage that was taken out on this home.
Original Mortgage
$363,375
Outstanding Balance
$313,166
Interest Rate
4.44%
Mortgage Type
New Conventional
Estimated Equity
$401,324
Purchase Details
Closed on
Jun 4, 2014
Sold by
Mercardante Patrick C
Bought by
Mercardante Kathryn J
Purchase Details
Closed on
Mar 7, 2005
Sold by
Mercardante Patrick C
Bought by
Mercardante Kathryn J
Purchase Details
Closed on
Nov 30, 2004
Sold by
Clark Harold and Clark Bridget
Bought by
Mercardante Patrick
Purchase Details
Closed on
Mar 31, 2000
Sold by
Higginbotham Builder
Bought by
Mercardante Patrick
Create a Home Valuation Report for This Property
The Home Valuation Report is an in-depth analysis detailing your home's value as well as a comparison with similar homes in the area
Home Values in the Area
Average Home Value in this Area
Purchase History
| Date | Buyer | Sale Price | Title Company |
|---|---|---|---|
| Aguar Nathaniel | $382,500 | -- | |
| Mercardante Kathryn J | -- | -- | |
| Mercardante Kathryn J | -- | -- | |
| Mercardante Patrick | -- | -- | |
| Mercardante Patrick | $320,000 | -- |
Source: Public Records
Mortgage History
| Date | Status | Borrower | Loan Amount |
|---|---|---|---|
| Open | Aguar Nathaniel | $363,375 |
Source: Public Records
Tax History Compared to Growth
Tax History
| Year | Tax Paid | Tax Assessment Tax Assessment Total Assessment is a certain percentage of the fair market value that is determined by local assessors to be the total taxable value of land and additions on the property. | Land | Improvement |
|---|---|---|---|---|
| 2024 | $4,373 | $233,967 | $36,000 | $197,967 |
| 2023 | $4,373 | $206,998 | $28,000 | $178,998 |
| 2022 | $3,926 | $183,202 | $28,000 | $155,202 |
| 2021 | $3,706 | $160,415 | $24,000 | $136,415 |
| 2020 | $3,704 | $160,069 | $24,000 | $136,069 |
| 2019 | $3,540 | $159,844 | $24,000 | $135,844 |
| 2018 | $3,740 | $156,286 | $24,000 | $132,286 |
| 2017 | $3,338 | $139,283 | $22,000 | $117,283 |
| 2016 | $3,191 | $133,098 | $22,000 | $111,098 |
| 2015 | $2,972 | $123,562 | $22,000 | $101,562 |
| 2014 | $2,953 | $119,987 | $22,000 | $97,987 |
| 2013 | -- | $123,276 | $28,000 | $95,276 |
Source: Public Records
Map
Nearby Homes
- 1191 Arizona Bend
- 1110 Colorado Bend
- 1700 Jimmy Daniel Rd
- 310 Marlborough Downs Rd
- 0 Tall Oaks Rd Unit 1027657
- 0 Tall Oaks Rd Unit 1027658
- 0 Tall Oaks Rd Unit 10550493
- 0 Tall Oaks Rd Unit 10550492
- 0 Julian Dr Unit 10476456
- 2232 Orchard Cir
- 1102 Blackstone Ct
- 255 Marlborough Downs Rd
- 3492 Orchard Cir
- 115 Altarstone Dr
- 367 Morning Dr
- 2080 Orchard Walk
- 363 Morning Dr
- 784 Fitzroy Dr
- 1371 Arizona Bend
- 1361 Arizona Bend
- 1381 Arizona Bend
- 1351 Arizona Bend
- 0 Kaplan Ct Unit 8482787
- 1011 Kaplan Ct
- 1380 Arizona Bend
- 1380 Arizona Bend
- 1391 Arizona Bend
- 1341 Arizona Bend
- 1011 Kaplan Ct
- 1341 Arizona Bend
- 1040 Arizona Bend
- 1510 Julian Dr
- 1520 Julian Dr
- 1390 Arizona Bend
- 1540 Julian Dr
- 1500 Julian Dr
- 1020 Bob White Ct
- 1040 Arizona Bend