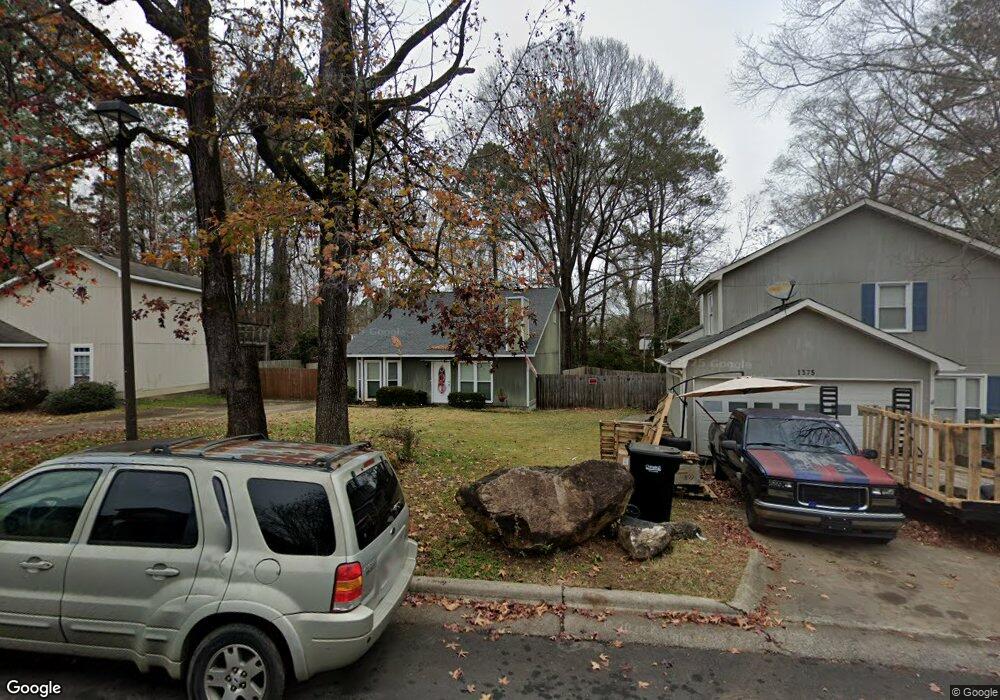
1371 Maplebrook Dr Columbus, GA 31904
North Columbus NeighborhoodEstimated Value: $180,000 - $217,000
2
Beds
2
Baths
1,531
Sq Ft
$133/Sq Ft
Est. Value
About This Home
This home is located at 1371 Maplebrook Dr, Columbus, GA 31904 and is currently estimated at $203,101, approximately $132 per square foot. 1371 Maplebrook Dr is a home located in Muscogee County with nearby schools including Double Churches Elementary School, Veterans Memorial Middle School, and Northside High School.
Ownership History
Date
Name
Owned For
Owner Type
Purchase Details
Closed on
Aug 9, 2019
Sold by
Perez Stantel T
Bought by
Blankenship Leisa Rae
Current Estimated Value
Home Financials for this Owner
Home Financials are based on the most recent Mortgage that was taken out on this home.
Original Mortgage
$125,875
Outstanding Balance
$110,243
Interest Rate
3.7%
Mortgage Type
New Conventional
Estimated Equity
$92,858
Purchase Details
Closed on
May 30, 2014
Sold by
Linlock Llc
Bought by
Burton Shantel T
Home Financials for this Owner
Home Financials are based on the most recent Mortgage that was taken out on this home.
Original Mortgage
$112,773
Interest Rate
4.36%
Mortgage Type
VA
Purchase Details
Closed on
Sep 27, 2013
Sold by
Sec Of Housing & U
Bought by
Linlock Llc
Purchase Details
Closed on
Nov 6, 2012
Sold by
Lane Ronald L
Bought by
Bank Of America
Create a Home Valuation Report for This Property
The Home Valuation Report is an in-depth analysis detailing your home's value as well as a comparison with similar homes in the area
Home Values in the Area
Average Home Value in this Area
Purchase History
| Date | Buyer | Sale Price | Title Company |
|---|---|---|---|
| Blankenship Leisa Rae | $132,500 | -- | |
| Burton Shantel T | $110,400 | -- | |
| Linlock Llc | $42,500 | -- | |
| Bank Of America | $83,126 | -- |
Source: Public Records
Mortgage History
| Date | Status | Borrower | Loan Amount |
|---|---|---|---|
| Open | Blankenship Leisa Rae | $125,875 | |
| Previous Owner | Burton Shantel T | $112,773 |
Source: Public Records
Tax History
| Year | Tax Paid | Tax Assessment Tax Assessment Total Assessment is a certain percentage of the fair market value that is determined by local assessors to be the total taxable value of land and additions on the property. | Land | Improvement |
|---|---|---|---|---|
| 2025 | $2,404 | $61,420 | $22,180 | $39,240 |
| 2024 | $2,404 | $61,420 | $22,180 | $39,240 |
| 2023 | $242 | $61,420 | $22,180 | $39,240 |
| 2022 | $1,986 | $48,636 | $16,636 | $32,000 |
| 2021 | $2,116 | $51,812 | $16,636 | $35,176 |
| 2020 | $2,116 | $51,812 | $16,636 | $35,176 |
| 2019 | $2,074 | $50,624 | $16,636 | $33,988 |
| 2018 | $2,074 | $50,624 | $16,636 | $33,988 |
| 2017 | $2,081 | $50,624 | $16,636 | $33,988 |
| 2016 | $1,822 | $44,160 | $4,902 | $39,258 |
| 2015 | $1,824 | $44,160 | $4,902 | $39,258 |
| 2014 | $827 | $20,003 | $4,902 | $15,101 |
| 2013 | -- | $31,433 | $4,902 | $26,531 |
Source: Public Records
Map
Nearby Homes
- 1442 Grove Park Dr Unit 2
- 1442 Grove Park Dr Unit 8
- 7724 Gray Shoals Dr
- 7730 Edgewater Dr
- 7841 Edgewater Dr
- 8334 Canaan Dr
- 1727 Fountain Ct
- 1438 Grove Park Dr Unit 13B
- 1438 Grove Park Dr Unit 11B
- 1608 Double Churches Rd
- 994 Timber Creek Way
- 907 Double Churches Rd
- 7309 Kirkwood Dr
- 6742 Bridge Way
- 1254 Cottage Pointe Ct
- 517 Double Churches Rd
- 1355 Cloverdale Rd
- 6712 Bridge Way
- 1195 Cloverdale Rd
- 1430 Cloverdale Rd
- 1375 Maplebrook Dr
- 1367 Maplebrook Dr
- 1379 Maplebrook Dr
- 1363 Maplebrook Dr
- 1383 Maplebrook Dr
- 1359 Maplebrook Dr
- 1370 Maplebrook Dr
- 1387 Maplebrook Dr
- 1378 Maplebrook Dr
- 1366 Maplebrook Dr
- 102 Maplebrook Ct
- 1355 Maplebrook Dr
- 8065 Twin Chapel Dr
- 1362 Maplebrook Dr
- 1400 Stanley Dr
- 8071 Twin Chapel Dr
- 1351 Maplebrook Dr
- 108 Maplebrook Ct
- 1358 Maplebrook Dr
- 112 Maplebrook Ct
Your Personal Tour Guide
Ask me questions while you tour the home.