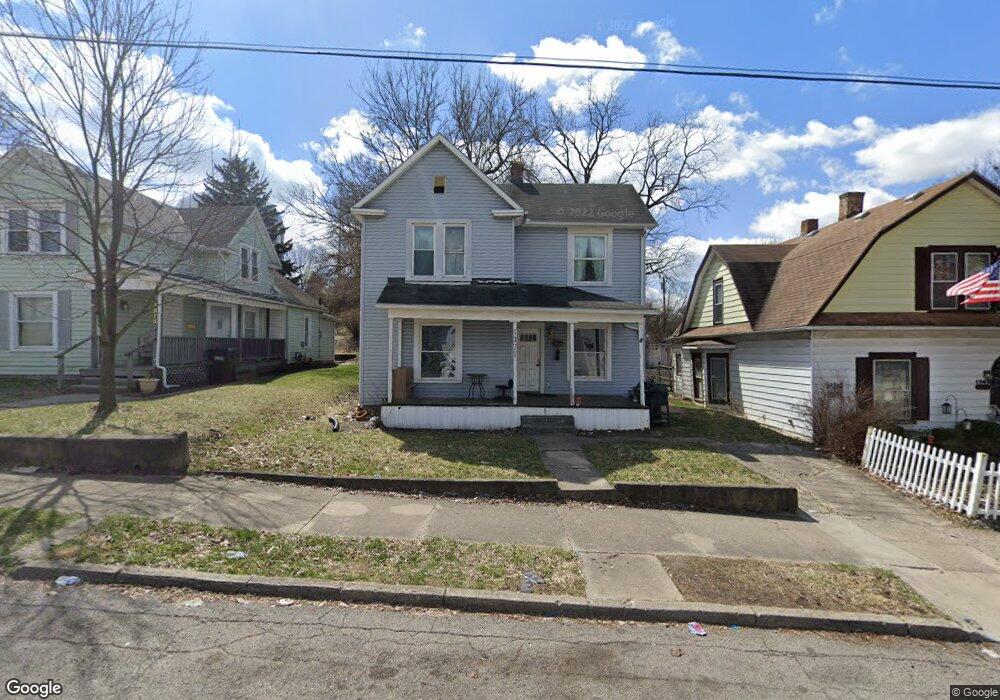
1371 Warder St Springfield, OH 45503
Estimated Value: $75,000 - $94,000
3
Beds
1
Bath
1,582
Sq Ft
$51/Sq Ft
Est. Value
About This Home
This home is located at 1371 Warder St, Springfield, OH 45503 and is currently estimated at $81,432, approximately $51 per square foot. 1371 Warder St is a home located in Clark County with nearby schools including Warder Park-Wayne Elementary School, Schaefer Middle School, and Springfield High School.
Ownership History
Date
Name
Owned For
Owner Type
Purchase Details
Closed on
Jun 8, 2023
Sold by
Hayes Jeff and Hayes Valerie
Bought by
Mo Mad Dad Properties Llc
Current Estimated Value
Purchase Details
Closed on
May 18, 2015
Sold by
Cr Homes Llc
Bought by
Hayes Jeff
Purchase Details
Closed on
Feb 13, 2015
Sold by
Bank Of America N A
Bought by
Cr Homes Llc
Purchase Details
Closed on
Jan 20, 2015
Sold by
Rowland Jodi and Riley Jodi
Bought by
Bank Of America Na
Purchase Details
Closed on
Nov 13, 2001
Sold by
Real Estate Solutions Unlimited Inc
Bought by
Riley Jodi
Home Financials for this Owner
Home Financials are based on the most recent Mortgage that was taken out on this home.
Original Mortgage
$68,820
Interest Rate
6.69%
Mortgage Type
FHA
Purchase Details
Closed on
Feb 29, 2000
Sold by
Parsons Karen M
Bought by
Bank One Na
Create a Home Valuation Report for This Property
The Home Valuation Report is an in-depth analysis detailing your home's value as well as a comparison with similar homes in the area
Home Values in the Area
Average Home Value in this Area
Purchase History
| Date | Buyer | Sale Price | Title Company |
|---|---|---|---|
| Mo Mad Dad Properties Llc | $60,000 | None Listed On Document | |
| Hayes Jeff | $14,600 | Team Title & Closing Svcs Ll | |
| Cr Homes Llc | $4,000 | Intitle Agency Inc | |
| Bank Of America Na | $10,000 | Attorney | |
| Riley Jodi | $69,900 | -- | |
| Bank One Na | $16,700 | -- |
Source: Public Records
Mortgage History
| Date | Status | Borrower | Loan Amount |
|---|---|---|---|
| Previous Owner | Riley Jodi | $68,820 |
Source: Public Records
Tax History Compared to Growth
Tax History
| Year | Tax Paid | Tax Assessment Tax Assessment Total Assessment is a certain percentage of the fair market value that is determined by local assessors to be the total taxable value of land and additions on the property. | Land | Improvement |
|---|---|---|---|---|
| 2024 | $1,073 | $21,730 | $2,120 | $19,610 |
| 2023 | $1,073 | $21,730 | $2,120 | $19,610 |
| 2022 | $1,100 | $21,730 | $2,120 | $19,610 |
| 2021 | $1,012 | $18,420 | $1,800 | $16,620 |
| 2020 | $1,015 | $18,420 | $1,800 | $16,620 |
| 2019 | $1,017 | $18,420 | $1,800 | $16,620 |
| 2018 | $919 | $15,980 | $1,800 | $14,180 |
| 2017 | $919 | $15,978 | $1,799 | $14,179 |
| 2016 | $920 | $15,978 | $1,799 | $14,179 |
| 2015 | $912 | $15,978 | $1,799 | $14,179 |
| 2014 | $908 | $15,978 | $1,799 | $14,179 |
| 2013 | $898 | $15,978 | $1,799 | $14,179 |
Source: Public Records
Map
Nearby Homes
- 1624 Highland Ave
- 1105 Farlow St
- 1311 E High St
- 1621 Prospect St
- 1704 Highland Ave
- 955 Avondale Ave
- 224 Glenn Ave
- 1030 Sherman Ave Unit 1032
- 1726 Highland Ave
- 1721 Prospect St
- 321 Glenn Ave
- 1715 Summit St
- 718 N Florence St
- 828 E Main St
- 360 S Greenmount Ave
- 929 E High St
- 26 N Belmont Ave
- 206-208 N Belmont Ave
- 1375 Warder St
- 1369 Warder St
- 1411 Warder St
- 1417 Warder St
- 126 N Greenmount Ave
- 122 N Greenmount Ave
- 130 N Greenmount Ave
- 120 N Greenmount Ave
- 1419 Warder St
- 1404 Highland Ave
- 1372 Warder St
- 1370 Highland Ave
- 114 N Greenmount Ave Unit 116
- 1414 Highland Ave
- 1421 Warder St
- 110 N Greenmount Ave
- 204 N Greenmount Ave Unit 206
- 1412 Highland Ave
- 1416 Highland Ave
- 1370 Warder St