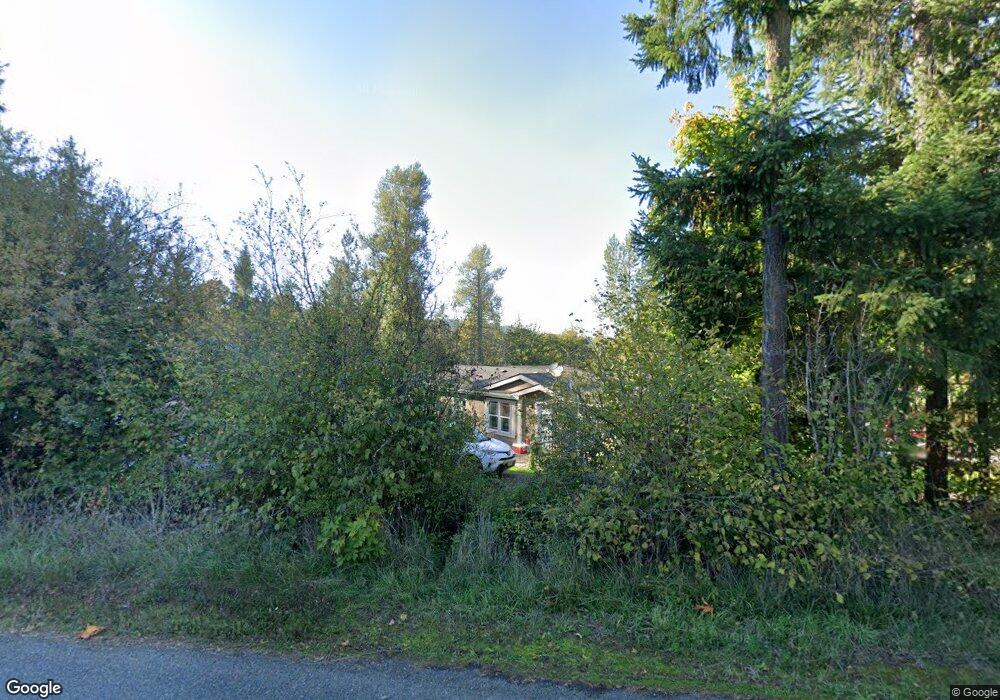
13711 S Leabo Rd Molalla, OR 97038
Estimated Value: $462,000 - $591,000
3
Beds
2
Baths
1,525
Sq Ft
$338/Sq Ft
Est. Value
About This Home
This home is located at 13711 S Leabo Rd, Molalla, OR 97038 and is currently estimated at $516,177, approximately $338 per square foot. 13711 S Leabo Rd is a home located in Clackamas County.
Ownership History
Date
Name
Owned For
Owner Type
Purchase Details
Closed on
Aug 28, 2015
Sold by
Secretary Of Housing & Urban Development
Bought by
Veelle Cody E
Current Estimated Value
Home Financials for this Owner
Home Financials are based on the most recent Mortgage that was taken out on this home.
Original Mortgage
$201,700
Outstanding Balance
$157,548
Interest Rate
3.91%
Mortgage Type
New Conventional
Estimated Equity
$358,629
Purchase Details
Closed on
Dec 9, 2014
Sold by
Moore Jason E and Moore Stacie L
Bought by
Wells Fargo Bank Na
Purchase Details
Closed on
Oct 31, 2014
Sold by
Wells Fargo Bank Na
Bought by
Secretary Of Housing & Urban Development
Purchase Details
Closed on
Sep 23, 2005
Sold by
Jones David and Jones Jean
Bought by
Moore Jason E and Moore Stacie L
Home Financials for this Owner
Home Financials are based on the most recent Mortgage that was taken out on this home.
Original Mortgage
$241,214
Interest Rate
5.72%
Mortgage Type
FHA
Create a Home Valuation Report for This Property
The Home Valuation Report is an in-depth analysis detailing your home's value as well as a comparison with similar homes in the area
Home Values in the Area
Average Home Value in this Area
Purchase History
| Date | Buyer | Sale Price | Title Company |
|---|---|---|---|
| Veelle Cody E | $224,112 | First American | |
| Wells Fargo Bank Na | $189,200 | None Available | |
| Secretary Of Housing & Urban Development | -- | None Available | |
| Moore Jason E | $247,000 | Transnation Title Agency Or |
Source: Public Records
Mortgage History
| Date | Status | Borrower | Loan Amount |
|---|---|---|---|
| Open | Veelle Cody E | $201,700 | |
| Previous Owner | Moore Jason E | $241,214 |
Source: Public Records
Tax History Compared to Growth
Tax History
| Year | Tax Paid | Tax Assessment Tax Assessment Total Assessment is a certain percentage of the fair market value that is determined by local assessors to be the total taxable value of land and additions on the property. | Land | Improvement |
|---|---|---|---|---|
| 2025 | $3,135 | $225,919 | -- | -- |
| 2024 | $3,025 | $219,339 | -- | -- |
| 2023 | $3,025 | $212,951 | $0 | $0 |
| 2022 | $2,537 | $206,749 | $0 | $0 |
| 2021 | $2,424 | $200,728 | $0 | $0 |
| 2020 | $2,359 | $194,882 | $0 | $0 |
| 2019 | $2,293 | $189,206 | $0 | $0 |
| 2018 | $2,231 | $183,695 | $0 | $0 |
| 2017 | $2,111 | $178,345 | $0 | $0 |
| 2016 | $1,968 | $173,150 | $0 | $0 |
| 2015 | $1,870 | $168,107 | $0 | $0 |
| 2014 | $1,742 | $160,821 | $0 | $0 |
Source: Public Records
Map
Nearby Homes
- 0 S Wilhoit Rd
- 36451 S Sawtell Rd Unit 16
- 36451 S Sawtell Rd Unit 10
- 36451 S Sawtell Rd
- 35517 S Aqua Springs Rd
- 15634 S Fawn View Way
- 15646 S Fawn View Way
- 15776 S Pierce Rd
- 35556 S Aqua Springs Rd
- 35544 S Aqua Springs Rd
- 37212 S Sawtell Rd
- 15931 S Forest Haven Rd
- 35458 S Ellis Rd
- 9924 S Wildcat Rd
- 35267 S Acer Ln
- 10285 S Rosewood Way
- 32604 S Krupicka Way
- 13595 S Warrick Rd
- 821 E 7th St
- 13434 S Lowe Rd
- 13732 S Leabo Rd
- 13774 S Leabo Rd
- 13608 S Leabo Rd
- 13878 S Leabo Rd
- 13914 S Leabo Rd
- 35995 S Wilhoit Rd
- 13978 S Leabo Rd
- 36013 S Wilhoit Rd
- 36136 S Wilhoit Rd
- 0 Wilhoit Unit 10067211
- 0 Wilhoit Unit 10072521
- 0 Wilhoit Unit 17369259
- 36200 S Wilhoit Rd
- 14071 S Leabo Rd
- 13755 S Leabo Rd
- 36404 S Wilhoit Rd
- 14325 S Leabo Rd
- 14115 S Leabo Rd
- 0 S Leabo Rd Unit 3002518
- 0 S Leabo Rd Unit 10022593