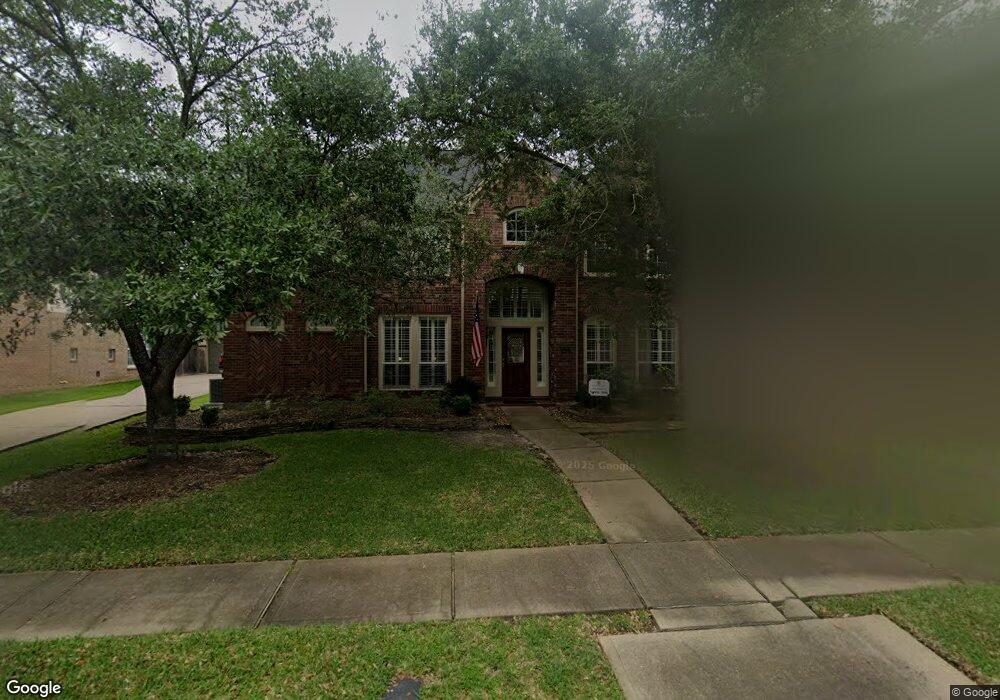
13714 Waverly Crest Ct Cypress, TX 77429
Estimated Value: $547,601 - $598,000
5
Beds
4
Baths
3,524
Sq Ft
$165/Sq Ft
Est. Value
About This Home
This home is located at 13714 Waverly Crest Ct, Cypress, TX 77429 and is currently estimated at $580,400, approximately $164 per square foot. 13714 Waverly Crest Ct is a home located in Harris County with nearby schools including Sampson Elementary School, Spillane Middle School, and Cypress Woods High School.
Ownership History
Date
Name
Owned For
Owner Type
Purchase Details
Closed on
Aug 8, 2008
Sold by
Cottrell Roy
Bought by
Mcclelland Dustin M and Mcclelland Kathryn H
Current Estimated Value
Home Financials for this Owner
Home Financials are based on the most recent Mortgage that was taken out on this home.
Original Mortgage
$216,000
Outstanding Balance
$142,738
Interest Rate
6.47%
Mortgage Type
Purchase Money Mortgage
Estimated Equity
$437,662
Purchase Details
Closed on
Sep 11, 2007
Sold by
Kaimbah Cottrell Mercy Nyokabi
Bought by
Cottrell Roy Hudson
Purchase Details
Closed on
Jul 13, 2005
Sold by
Cottrell Victoria P
Bought by
Cottrell Roy
Purchase Details
Closed on
Jun 21, 2000
Sold by
Homes Perry
Bought by
Cottrell Roy and Cottrell Victoria P
Home Financials for this Owner
Home Financials are based on the most recent Mortgage that was taken out on this home.
Original Mortgage
$130,000
Interest Rate
8.66%
Create a Home Valuation Report for This Property
The Home Valuation Report is an in-depth analysis detailing your home's value as well as a comparison with similar homes in the area
Home Values in the Area
Average Home Value in this Area
Purchase History
| Date | Buyer | Sale Price | Title Company |
|---|---|---|---|
| Mcclelland Dustin M | -- | Startex Title Company | |
| Cottrell Roy Hudson | -- | None Available | |
| Cottrell Roy | -- | -- | |
| Cottrell Roy | -- | Chicago Title |
Source: Public Records
Mortgage History
| Date | Status | Borrower | Loan Amount |
|---|---|---|---|
| Open | Mcclelland Dustin M | $216,000 | |
| Previous Owner | Cottrell Roy | $130,000 | |
| Closed | Cottrell Roy | $0 |
Source: Public Records
Tax History Compared to Growth
Tax History
| Year | Tax Paid | Tax Assessment Tax Assessment Total Assessment is a certain percentage of the fair market value that is determined by local assessors to be the total taxable value of land and additions on the property. | Land | Improvement |
|---|---|---|---|---|
| 2025 | $7,499 | $495,856 | $104,521 | $391,335 |
| 2024 | $7,499 | $505,317 | $95,060 | $410,257 |
| 2023 | $7,499 | $524,252 | $95,060 | $429,192 |
| 2022 | $9,233 | $445,432 | $68,029 | $377,403 |
| 2021 | $8,893 | $350,000 | $68,029 | $281,971 |
| 2020 | $9,428 | $359,259 | $54,965 | $304,294 |
| 2019 | $9,620 | $355,530 | $54,965 | $300,565 |
| 2018 | $3,637 | $346,997 | $54,965 | $292,032 |
| 2017 | $9,425 | $346,997 | $54,965 | $292,032 |
| 2016 | $9,425 | $346,997 | $54,965 | $292,032 |
| 2015 | $6,672 | $346,997 | $54,965 | $292,032 |
| 2014 | $6,672 | $346,997 | $54,965 | $292,032 |
Source: Public Records
Map
Nearby Homes
- 16406 Haden Crest Ct
- 13703 Layton Hills Dr
- 16606 Darby House St
- 13506 Key Ridge Ln
- 16322 Bontura St
- 14015 Falcon Heights Dr
- 16219 Haden Crest Ct
- 16306 Bontura St
- 16515 Dunleith Cir
- 16211 Halpren Falls Ln
- 14015 Halprin Creek Dr
- 13611 Monteigne Ln
- 16342 Granite Park Ct
- 13402 Layton Castle Ln
- 15902 Mill Canyon Ct
- 16502 Rawhide Trail
- 16514 Boston Post Rd
- 16518 Boston Post Rd
- 16131 Cypress Point Dr
- 16530 Boston Post Rd
- 13718 Waverly Crest Ct
- 13710 Waverly Crest Ct
- 13715 Greenwood Manor Dr
- 13719 Greenwood Manor Dr
- 13722 Waverly Crest Ct
- 13711 Greenwood Manor Dr
- 16510 Evergreen Lake Ln
- 13715 Waverly Crest Ct
- 13711 Waverly Crest Ct
- 13723 Greenwood Manor Dr
- 16506 Evergreen Lake Ln
- 13719 Waverly Crest Ct
- 13707 Waverly Crest Ct
- 16502 Evergreen Lake Ln
- 13727 Greenwood Manor Dr
- 13726 Waverly Crest Ct
- 13723 Waverly Crest Ct
- 13703 Waverly Crest Ct
- 13731 Greenwood Manor Dr
- 13731 Waverly Crest Ct